Thematic Investing Can Add a Ton of Value to Portfolios

Key Summary:

  • Earnings season has begun, we have some solid reports across the brands universe.
  • Streaming video & entertainment has become a consumer staple. Netflix wins.
  • In the asset management industry, private markets are where the information advantages are real. Blackstone wins.

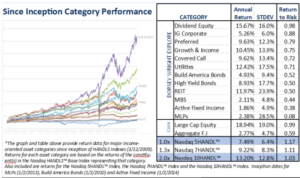
Very Important thesis: If equities generate roughly ~10-11% a year over time, leading brands, dominant global franchises, particularly those serving the dominant driver of the economy, in theory, should compound at 13-15%+ over time. In a world where rates and inflation will likely trend higher for longer, business models with pricing power, exposure to quality factors, and that generate strong profits and free cash are set up to win versus broad markets. Brands Matter.

Earnings Season Has Begun. Here’s a few portfolio brands executing well.

I love earnings season. Each quarterly report is a new piece of the puzzle, and it lets us know what management teams are thinking about their respective businesses, industries, and the economy in general. Remember, our investment in stocks is a De facto vote of confidence on the economies in which we invest. Earnings, revenue, margins, free cash flow, and the growth of these important metrics is what drives stocks up or down over time. As someone who invests but also likes to actively trade when markets act irrational, earnings season tends to offer some wonderful tactical trading opportunities along with offering great, long-term information for buy-hold investors. The next few notes, I’ll discuss some earnings reports and secular themes we are very excited about for the future.

Image created in 10 seconds using AI via ChatGPT. Very cool!

Netflix: NFLX

Remember when the cable industry was one of the most stable and predictable industries?

Legacy media brands sat by and let a new company, Netflix carve out a new market and take market share slowly, then all at once. Fast forward to today, Netflix is now the new cable and the first place most consumer begin their entertainment and content search. This nuance is a massive behavioral moat for Netflix, and I never hear anyone talking about it. Netflix reported a strong and stable quarter on October 17th and the stock is +10% on the 18th, last I checked. Here’s why we continue to like Netflix and why it’s a core holding as a dominant Mega Brand and a consumer staple.

The Report & Our View of the Stock:

Lots of growth potential around the world. 283 million paid subscribers headed much higher over time. Q3, revenue +15% YOY, operating margins 30% vs 22% last year. For Q4, they forecast 15% revenue growth and expect paid net additions to be higher than this quarters 5.1M sub growth. For 2025, they forecast revenue of $43-44B which is +11-13% growth, slower than 2024 but we expected this to moderate as password sharing opportunities diminish. Margins should continue to rise over time as content spend stays stable and revenue and free cash flow expand. And make no mistake, Netflix has solid pricing power to raise prices and drive more ad-tier subs. This business has become a solid consumer staple that adds significant value to a consumer’s life as a primary entertainment provider. The low cost of the service keeps churn low and engagement solid. Live sports and sports-related content will continue to grow bringing in new entrants. NFLX had the benefit of building a massive library of content fueled by debt when rates were largely at ZERO while peers in the industry sat idle and watched NFLX take their businesses. Now they are scrambling to compete in a world with much higher cost of capital and higher content costs. All in all, Netflix offers one of the best value propositions to consumers, has become THE place consumers start their content and entertainment searches which keeps churn low and pricing power high. This is a very powerful flywheel that grows over time with new and intriguing content added.  Traditional consumer staples grow much less, do not generate this kind of profitability and margins and trade at the same multiple or higher as Netflix. More and more, consumer staple brands do not just live in the staples sector. With technology at the center of our lives, there are plenty of tech staples located in plain sight. Yes, tech and communication services stocks can be volatile, but just because their stock can be volatile, do not assume their business is volatile so when these staples go on sale, they are wonderful buying opportunities.

Blackstone: BX

The democratization of alternatives via private market access continues. Blackstone is the largest alternative asset manager on the planet at $1.1Trillion and growing assets at a rapid clip. The crazy part: there is so much room for growth ahead, particularly in the wealth management industry as most HNW investors have very little exposure overall. Here’s a crazy truth: these stocks are very under-owned and underrepresented in indexes, ETF’s, and active funds. And they have been massive alpha generators over the S&P 500. Apollo still needs to be added to the S&P and it’s a matter of WHEN, not IF.

The Brands portfolio owns a basket of the leaders because the secular growth opportunity remains enormous. Blackstone, KKR, Apollo and these brands are the smartest investors around the globe, have massive access to capital in good times and bad, have a wicked information advantage because they each own hundreds of private companies that give them the ability to look around corners for future trends. And they have hundreds of billions in dry powder to buy assets when they go on sale. No matter what the calamity, these great investors always seem to find a way to capitalize on turmoil. Stable, attractive performance just drives more asset flows which drives higher fee revenue which drives the stocks higher.

Like Netflix, the alts business is a wonderful flywheel and the benefits compound over time at scale. Just remember, these stocks can be volatile at times, so you often get a chance to buy them on dips. We love to hold the core position and trade around the position, using the vol to our advantage.

The Report & Our View of the Stock:

Overall, a solid quarter with solid trends for a good 2025. Massive $40.5B new flows this quarter dominated by private credit & insurance but good overall flows into Infrastructure, core PE, plus good fund raising in other real estate and opportunistic credit funds. Management fees $1.7B. Deployed $34B broadly across credit, PE, RE but credit was the big deployment area. Performance stable and solid across fund verticals, with real estate slowly recovering.  $1.17T in assets with $171B in dry powder, so they have massive opportunities to put a lot of money to work over time and to generate solid fees that grow over time. 2025 is expected to show better realizations, and deployments as M&A heats up and sentiment gets better leading to more deals. Their deployments continue to be focused on data centers globally, AI, software, life sciences, and shelter opportunities along with renewables and energy. All of which tend to be solid inflation beneficiaries as rates are expected to stay elevated with elevated inflation.

Image created in 10 seconds using AI via ChatGPT.

Disclosure: The above data is for illustrative purposes only.  This information was produced by Accuvest and the opinions expressed are those of the author as of the date of writing and are subject to change. Any research is based on the author’s proprietary research and analysis of global markets and investing. The information and/or analysis presented have been compiled or arrived at from sources believed to be reliable, however the author does not make any representation as their accuracy or completeness and does not accept liability for any loss arising from the use hereof. Some internally generated information may be considered theoretical in nature and is subject to inherent limitations associated therein. There are no material changes to the conditions, objectives or investment strategies of the model portfolios for the period portrayed. Any sectors or allocations referenced may or may not be represented in portfolios managed by the author, and do not represent all of the securities purchased, sold or recommended for client accounts.  The reader should not assume that any investments in sectors and markets identified or described were or will be profitable. Investing entails risks, including possible loss of principal. The use of tools cannot guarantee performance. The charts depicted within this presentation are for illustrative purposes only and are not indicative of future performance. Past performance is no guarantee of future results.


Investing in Big Rivers is a No-Brainer, Common Sense Decision.

Key Summary:

  • There is no other broad market theme bigger than global consumer spending.
  • The easiest and most defendable allocation decision is to add consumer exposure.
  • The equal-weight Consumer Discretionary basket continues to outperform Staples.

Very Important thesis: If equities generate roughly ~10% a year over time, leading brands, dominant global franchises, particularly those serving the dominant driver of the economy, in theory, should compound at 13-15%+ over time. In a world where rates and inflation will likely trend higher for longer, business models with pricing power, exposure to quality factors, and that generate strong profits and free cash are set up to win versus broad markets. Brands Matter.

Don’t Ignore a $50+ Trillion Theme in Your Portfolio.

The U.S. is a roughly $28 trillion economy and a leader in innovation across sectors. Thank heavens the bulk of our portfolio is tied to the #1 economy in the world. Whether we realize it or not, our investment decisions and our home bias make us reliant on the U.S. economy. Staying up to speed on the core driver of the economy is a very important factor when managing U.S.-centric portfolios. Holding one or a few dedicated investments in this theme makes that easier. As I’ve written many times, our economy is consumer-spending focused. Spending on needs and wants is in our DNA which makes investing in this theme not only logical but highly profitable. One belief I have stated over and over: If the S&P 500 returns about 10% long-term, the best companies, the dominant franchises operating across important industries should compound greater than the market overall. It’s these companies where our team focuses 100% of our time. I used the +13-15% annual returns as an internal benchmark for leading brands over full market cycles. This is what we should expect and what the data has shown long-term.

The chart below simplifies the opportunity for investors by showing how important the consumption component of GDP is in America. Retail Sales alone is about $7 trillion a year. Consumers spend across a variety of “needs” categories as well as “wants” categories. We invest in leading brands across both needs and wants. Additionally, we are a service economy so roughly two-thirds of GDP comes from services and small businesses. Fun fact, household consumption drives every major economy making a global brands allocation an easy core equity choice for allocators. The consumption in the U.S. accounts for about $18.9 trillion per Morgan Stanley and it grows 2-3% each year with alarming predictability. Even a global pandemic cannot stop us consuming for very long. Just to put an exclamation point on this statement, very few investors have sufficient exposure to the brands dominating across important consumption categories. ETF’s are under-exposed, active funds are under-exposed, and retail investors who chase momentum in tech are wildly under-exposed to iconic consumer brands. That’s the opportunity. Adding important exposure to stocks that are superior operators, have global sales opportunities, and have stellar long-term track records is an easy decision.

Market Health Update: Discretionary is Outperforming Staples (defensives).

Most investors invest in sectors via ETF’s and funds. It’s important to compare the major ETF’s and market cap weighted strategies with equal-weighted strategies because sometimes, the most popular ETF does not tell the whole story in a sector. Monitoring the equal-weighted indices across discretionary & staples is vital to understanding the strength or weakness underlying the real economy. Remember, having this knowledge will help you across all the investments you hold given how reliant everything is to our economy.

The discretionary sector struggled as did all growth and quality-oriented areas of the market in 2022. That was a classic re-set and a raging opportunity to add exposure. About mid-year 2022, something happened, discretionary stocks vs staples stopped underperforming and began to outperform. This tends to happen after big market dislocations, beta begins to outperform low vol. The chart below shows a ratio chart of the equal-weight discretionary vs staples performance. When the line is rising, discretionary stocks are outperforming defensives. The rising line highlights the markets appetite for risk-taking and the overall health of the economy. For now, it’s clearly saying more positive things than you might hear from the media.

Market-Cap Weighted Investments Are Masking Underlying Strength.

Important: most assets across all sectors and index investments are invested in market-cap weighted strategies. That’s been helpful at the index level and has led investors astray when analyzing the consumer stocks. Here’s how the market-cap weighted sector strategies look vs the bullish equal-weighted ones. The chart shows discretionary stocks still under a downtrend but threatening to break over the downtrend.

If I saw this chart and it was a stock, I would say the direction is inconclusive until a clean break of the downtrend line has been accomplished. Clearly, this chart tells a different story than the one above which screams, offense over defense generally across consumer stocks. Both are performing but one is performing better than the other.

SUMMARY:

The over-arching message these ratio charts are telling us: broadly, the consumer stocks are performing better than defensive staples which remains a bullish sign for the U.S. economy and therefore equity markets today. And remember, algorithms and zero-days to expiration index options drive daily market volume so if you are engaged in equities, you must absorb the daily volatility they create. We like to use this volatility to our advantage with fast-twitch active trading when we see the opportunity, which offers a unique and differentiated edge in today’s volatile world.

A reminder about our approach: 1) Offense (discretionary, tech, communication services, and alternative asset managers), 2) Defense (staples, healthcare, holding excess cash), and 3) Special teams (active, fast-twitch trading which can offer multiple years of a company dividend in less than 30 days of risk exposure when executed properly).

Disclosure: The above data is for illustrative purposes only.  This information was produced by Accuvest and the opinions expressed are those of the author as of the date of writing and are subject to change. Any research is based on the author’s proprietary research and analysis of global markets and investing. The information and/or analysis presented have been compiled or arrived at from sources believed to be reliable, however the author does not make any representation as their accuracy or completeness and does not accept liability for any loss arising from the use hereof. Some internally generated information may be considered theoretical in nature and is subject to inherent limitations associated therein. There are no material changes to the conditions, objectives or investment strategies of the model portfolios for the period portrayed. Any sectors or allocations referenced may or may not be represented in portfolios managed by the author, and do not represent all of the securities purchased, sold or recommended for client accounts.  The reader should not assume that any investments in sectors and markets identified or described were or will be profitable. Investing entails risks, including possible loss of principal. The use of tools cannot guarantee performance. The charts depicted within this presentation are for illustrative purposes only and are not indicative of future performance. Past performance is no guarantee of future results.

The Next Potential Volatility Explosion: Oil

Oil Shocks and Their Impact on the Stock Market: A Historical Overview

Oil shocks throughout history, whether caused by geopolitical conflicts or disruptions in production, have had significant effects on both the global economy and stock markets. Events like the 1973 Arab Oil Embargo and the 1979 Iranian Revolution led to sharp supply shortages, surging prices, and steep market declines, as economies struggled with inflation and stagnation. Similarly, more recent shocks, such as Iraq’s invasion of Kuwait in 1990 and Russia’s invasion of Ukraine in 2022, caused market volatility due to rising oil prices and global uncertainty. Understanding these historical patterns is crucial for portfolio managers seeking to mitigate risks during future oil disruptions.

By analyzing past oil shocks and market reactions, investors can better prepare for potential downturns and explore strategies to hedge against volatility. Maintaining a diversified portfolio and considering exposure to the energy sector are effective ways to navigate the unpredictability of global oil supplies.

Oil shocks, significant disruptions in the global oil supply that cause price spikes, have consistently influenced the stock market. Let’s delve into some major oil shocks and their market reactions:

1. 1973 Oil Crisis (Arab Oil Embargo)

  • Cause: OPEC’s reduction of oil exports to the U.S. and allies in response to the Yom Kippur War.
  • Impact: A 300% surge in oil prices, energy shortages, soaring inflation, and global recession.
  • Market Reaction: Stock markets plummeted due to rising energy costs and economic uncertainty. Inflationary pressures, known as “stagflation,” led to a prolonged period of economic instability and market recovery.

The 1973 oil crisis, triggered by OPEC’s reduction of oil exports in response to the Yom Kippur War, was a significant shock to the US economy. The oil price surge of 300% led to energy shortages, soaring inflation, and a global recession. The stock market experienced a near-50% decline, reflecting the widespread economic uncertainty. Today, a similar supply disruption localized to Iran might have a less severe impact due to increased energy diversification. However, a broader conflict involving other oil-producing states could escalate into a much larger supply shock, potentially leading to more significant economic consequences.

2. 1979 Oil Crisis (Iranian Revolution)

  • Cause: Disruptions in Iranian oil production due to the revolution.
  • Impact: A doubling of oil prices, high inflation, and economic stagnation.
  • Market Reaction: Stock markets experienced another significant drop, further exacerbated by domestic inflation. Recovery was slow, with inflation persisting into the early 1980s.

The 1979 oil crisis, caused by disruptions in Iranian oil production due to the revolution, led to a significant oil price spike, doubling prices and contributing to high inflation and economic stagnation. The stock market experienced a substantial decline, further exacerbated by domestic inflation. Recovery was slow, with inflation persisting into the early 1980s. Today, a similar supply shock originating from Iran could have a comparable impact. The 1970s were a volatile period, characterized by a struggling economy and a highly volatile stock market with multiple double-digit corrections. The introduction of Reaganomics, known for its tax cuts and deregulation policies, might also find parallels in today’s economic landscape.

3. 1990-1991 Gulf War (Iraq’s Invasion of Kuwait)

  • Cause: Threats to oil production in a major oil-producing region.
  • Impact: A temporary increase in oil prices, but less severe than previous crises.
  • Market Reaction: A temporary decline in stock markets, followed by a relatively quick recovery. The economic damage was less pronounced.

The 1990-1991 Gulf War, triggered by Iraq’s invasion of Kuwait, disrupted oil production in a major oil-producing region. This led to a temporary increase in oil prices, although less severe than the previous two crises. The stock market experienced a temporary decline, but recovered relatively quickly. The economic damage was less pronounced compared to the earlier oil shocks, despite the significant disruption in oil supply caused by the war.

4. 2008 Financial Crisis

  • Cause: A global economic downturn triggered by the housing market collapse.
  • Impact: Decreased oil demand and a temporary drop in oil prices.
  • Market Reaction: A dramatic collapse in stock markets worldwide, with the oil sector hit hard. The market experienced a prolonged recovery with high volatility.

The 2008 financial crisis, triggered by the housing market collapse, represents a distinct departure from previous oil shocks. While there was no supply-driven disruption, the global economic downturn led to decreased oil demand. The oil sector was significantly impacted, and the stock market experienced a dramatic collapse. The unusual circumstances of the crisis, including the collapse of banks and disruptions in global trade, led to a prolonged period of market volatility and economic recovery.

A key factor contributing to the economic downturn was the sharp rise in oil prices during the early stages of the crisis. These elevated prices further exacerbated the economic weakness, creating a vicious cycle of rising costs and declining demand. Ultimately, the weak economy forced a decrease in oil demand, leading to a decline in oil prices.

While there were various factors influencing the oil price increase, including speculation and geopolitical tensions, the overall economic weakness played a significant role in driving prices down. This unique combination of circumstances made the 2008 oil shock distinct from previous events.

5. 2022 Russia-Ukraine War

  • Cause: Sanctions on Russia, a major oil producer, following its invasion of Ukraine.
  • Impact: A sharp rise in oil prices, increased inflation, and economic uncertainty.
  • Market Reaction: Initial stock market declines due to fears of prolonged conflict, followed by volatility and a surge in energy sector stocks. The long-term impact remains uncertain.

The 2022 Russia-Ukraine War, marked by sanctions on Russia, a major oil producer, closely resembles the current economic landscape. The sharp rise in oil prices, reminiscent of previous oil shocks, has contributed to increased inflation and economic uncertainty. While the potential for increased US oil production could help mitigate price increases, the current situation has exacerbated an already challenging economic environment. Similar to past oil shocks, the rise in oil prices has contributed to higher inflation, leading to stock market declines.


Key Takeaways:

  • Oil shocks can lead to significant short-term volatility and long-term economic impacts.
  • The severity of market reactions varies based on the duration and magnitude of oil price spikes.
  • Economic conditions, interest rates, and investor sentiment also influence stock market performance during oil shocks.
  • Understanding the historical context of oil shocks can help investors better anticipate and navigate potential market disruptions.

While it may be tempting to increase our energy allocation in response to rising oil prices, it’s crucial to maintain a cautious approach. Predicting the future direction of oil prices is challenging, as various factors, including geopolitical events and global economic conditions, can influence supply and demand.

One potential scenario is an attack on Iran’s oil facilities, which could significantly disrupt global oil supply. However, it’s equally possible that the market is already anticipating such an event, leading to increased oil production elsewhere. This uncertainty highlights the importance of remaining flexible and prepared for potential volatility.

As a portfolio manager, it’s prudent to maintain our appropriate allocations while incorporating additional volatility measures. By remaining diversified and considering potential market swings, we can better manage risk and position our portfolio for long-term success.

The Future is Finally Here: September 2024 HANDLS Monthly Report

The Future Is Finally Here

After a year of waiting, investors were finally rewarded with an interest rate cut when the Federal Reserve’s Federal Open Market Committee (FOMC) cut the federal funds rate by 50 basis points (0.50%) on September 18th. In announcing the decision, the FOMC noted that it had “had gained greater confidence that inflation is moving sustainably toward 2 percent” and “that the risks to achieving its employment and inflation goals are roughly in balance.”

The FOMC’s decision followed August’s release of the Consumer Price Index (CPI) report. Monthly inflation came in at 0.2%, in line with expectations. For the 12-month period ending in August, inflation was 2.5%, the lowest level since February 2021. The Federal Reserve’s preferred inflation measure, the Personal Consumption Expenditures Index (PCE), offered even better news, with inflation coming in at 0.1% for August and 2.2% for the 12-month period.

Partly driving the FOMC’s decision were economic reports indicating a softening in what had been a robust economy. The Institute for Supply Management’s monthly survey of purchasing managers came in below expectations for August, while the Bureau of Labor Statistics jobs report indicated that nonfarm payrolls expanded by only 142,000 jobs during the month (against expectations of 161,000 jobs). Both the equity and bond markets responded favorably to the cut in interest rates, with the Core Large Cap Equity and Core Fixed categories gaining 2.5% and 1.3%, respectively, for the month of September.

For the Nasdaq Dorsey Wright Explore portion of HANDLS Indexes, interest-rate-sensitive categories continued to be the biggest beneficiaries of softening inflation and lower interest rates. Utilities saw the biggest boost, gaining 6.6% for the month of September, pushing year-to-date returns to an eye-popping 30.2%. REITs also continued their recent hot strike, gaining 3.2% for the month. At the other end of the spectrum, MLPs were the worst performer for the third straight month (-0.4%) but remained up 17.8% on the year.

HANDLS indexes delivered positive returns across the board in September:

  • Nasdaq 5HANDL™ Index: 1.8%
  • Nasdaq 7HANDL™ Index: 2.2% (1.3x leveraged)
  • Nasdaq 10HANDL™ Index: 3.2% (2.0x leveraged)

Disclosure: Nasdaq® is a registered trademark of Nasdaq, Inc. The information contained above is provided for informational and educational purposes only, and nothing contained herein should be construed as investment advice, either on behalf of a particular security or an overall investment strategy. Neither Nasdaq, Inc. nor any of its affiliates makes any recommendation to buy or sell any security or any representation about the financial condition of any company. Statements regarding Nasdaq-listed companies or Nasdaq proprietary indexes are not guarantees of future performance. Actual results may differ materially from those expressed or implied. Past performance is not indicative of future results. Investors should undertake their own due diligence and carefully evaluate companies before investing. ADVICE FROM A SECURITIES PROFESSIONAL IS STRONGLY ADVISED. © 2024. Nasdaq, Inc. All Rights Reserved

Important Disclosure. HANDLS Indexes receives compensation in connection with licensing its indices to third parties. Any returns or performance provided within are for illustrative purposes only and do not demonstrate actual performance. Past performance is not a guarantee of future investment results. It is not possible to invest directly in an index. Exposure to an asset class is available through investable instruments based on an index. HANDLS Indexes does not sponsor, endorse, sell, promote or manage any investment fund or other vehicle that is offered by third parties and that seeks to provide an investment return based on the returns of any index.  There is no assurance that investment products based on an index will accurately track index performance or provide positive investment returns. HANDLS Indexes is not an investment advisor, and HANDLS Indexes makes no representation regarding the advisability of investing in any such investment fund or other vehicle. A decision to invest in any such investment fund or other vehicle should not be made in reliance on any of the statements set forth in this document. Prospective investors are advised to make an investment in any such fund or other vehicle only after carefully considering the risks associated with investing in such funds, as detailed in an offering memorandum or similar document that is prepared by or on behalf of the issuer of the investment fund or other vehicle. Inclusion of a security within an index is not a recommendation by Indexes to buy, sell, or hold such security, nor is it considered to be investment advice. The information contained herein is intended for personal use only and should not be relied upon as the basis for the execution of a security trade. Investors are advised to consult with their broker or other financial representative to verify pricing information for any securities referenced herein. Neither Indexes nor any of its direct or indirect third-party data suppliers or their affiliates shall have any liability for the accuracy or completeness of the information contained herein, nor for any lost profits, indirect, special or consequential damages. Either Indexes or its direct or indirect third-party data suppliers or their affiliates have exclusive proprietary rights in any information contained herein. The information contained herein may not be used for any unauthorized purpose or redistributed without prior written approval from HANDLS Indexes. Copyright © 2024 by HANDLS Indexes. All rights reserved.