Tag Archive for: brands

What’s the Real Value of Active Management?

Key Summary:

  • ETF’s have become the preferred investment wrapper of choice for investors.
  • The vast majority of ETF assets are passive, rules-based, & market-cap weighted.
  • Active strategies with high tracking error can add significant value to the portfolio mix.

Very Important thesis: If equities generate roughly ~10-11% a year over time, leading brands, dominant global franchises, particularly those serving the dominant driver of the economy, in theory, should compound at 13-15%+ over time. In a world where rates and inflation will likely trend higher for longer, business models with pricing power, exposure to quality factors, and that generate strong profits and free cash are set up to win versus broad markets. Brands Matter.

ETFs are the Preferred Investment Wrapper.

The data is very clear: actively managed mutual funds continue to lose assets to ETF’s. That’s the headline we all see every day. Remember, headlines are bold because they want your attention, the real story lives in the details. It makes sense that a portion of the active market is losing share to ETFs. Why pay a higher fee for a less tax efficient strategy, particularly if it’s a closet index strategy? In my opinion, true active strategies have a very important role in portfolios as complements to passive, cheap beta. Advisors need to understand what they own. Are the active funds’ benchmark huggers or do they do things very differently than the benchmark? Is there a similar strategy available in an ETF wrapper? Important: to have the chance to beat a benchmark, a strategy needs to look very different than the benchmark. The way to track this is by using Tracking Error. A high tracking error means the fund looks very different and can therefore be very valuable to a portfolio from a diversification and returns perspective. If you can get access to the themes you want and do it in a tax efficient wrapper while gaining high tracking error, congratulations, that’s valuable! Spoiler alert: that’s not easy to do, it requires a lot of research and sadly, the analytics providers do not make the research easy because they rarely look at the sector, sub-industry, and single-stock level.

In this week’s note, I’ll make the case that active deserves a place in portfolio’s along with passive ETF’s. Thank heavens there are more active ETF’s being launched because the market has been dominated by passive, rules-based, market cap weighted ETF’s (90% of ETF assets). What does that mean for a portfolio? It means more and more portfolio’s look the same and they are more tied to MOMENTUM as a style factor than ever before. That works until it doesn’t. This also means, benchmark hugging active managers are also too tethered to the momentum factor making “size and momentum” the biggest part of most portfolios.

Active, Contrarian Opportunities Are Everywhere.

Image: Created for Eric Clark by ChatGPT.

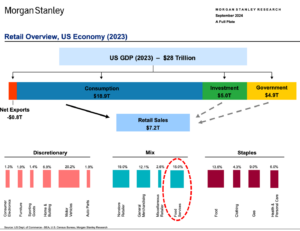
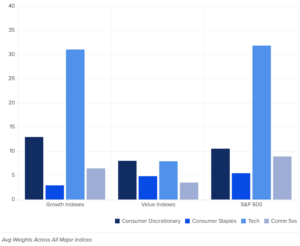
I am not saying run from passive, market-cap weighted ETF’s, I’m simply saying properly active strategies should be blended with passive, so portfolio’s get the benefit from many different style factors and exposures. As more and more “active funds” take on more passive characteristics, the value of true active strategies will grow by leaps and bounds. One area that’s likely the least crowded trade: the Consumer Discretionary, Consumer Staples, and Communication Services sectors. Our team traffics in highly relevant, high quality global brands. Many of which live in these three sectors and as you can see below, at the index level, these sectors are under-represented in a meaningful way, while a heavy tech weighting drives the returns. If the S&P 500 is the proxy investment for an allocation to the U.S. economy, and the economy is 70% household consumption, why on earth would the weighting to Consumer Discretionary & Staples be this low? We think that’s the opportunity today for investors.

I can almost guarantee your portfolio is chronically underweight the primary beneficiaries of a consumption-led economy. As you can see below, Tech holds the highest weighting across blend and growth indexes and Consumer Discretionary, Staples, and Communication Services is low. In the brands portfolio, we have 2-3x the discretionary and staples exposure, 40% more communication services and one-third the tech exposure. Our tracking error is almost 10, and this is not an accident.

What Does High Tracking Error Look Like?

To highlight the high tracking error theme, below I show a chart of the top 10 brands and the weights in the Brands portfolio relative to the S&P 500 and the Russell 1000 Growth Index. Remember, these two broad style boxes are where the bulk of the typical portfolio is allocated. In the brands strategy, we focus on the dominant global theme of household consumption and business innovation spending through the leading brands. According to the economy and business cycle, we allocate to important sub-themes through market share leaders. Here’s why the tracking error is high. We own a lot of brands that are significantly under-represented or fully absent from indexes. That’s valuable!

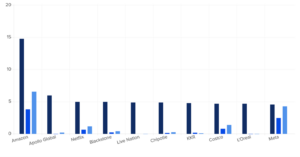
The Top 10 Brands in the Brands Portfolio (57% of the total):

  1. Amazon: 15% versus 3.8% (S&P 500), 6.6% (R1Growth).
  2. Apollo Global: 6% versus ,0.55% in both indexes.
  3. Netflix: 5% versus <1.2%.
  4. Live Nation: 4.9% versus essentially 0%.
  5. Blackstone: 5% versus <.50%.
  6. Chipotle: 4.9% versus <.30%.
  7. KKR: 4.9% versus <0.20%.
  8. Costco: 4.7% versus <1.5%.
  9. L’Oreal: 4.7% versus 0%.
  10. Meta: 4.6% versus <4%.

Bottom Line:

  1. If you own any active funds or ETF’s, make sure they are truly active and have high tracking error to the benchmark.
  2. Blend active and passive in a portfolio to achieve maximum diversification and return benefits.
  3. Do not ignore the winners in a consumption led global economy, these brands are wonderful businesses, have significant economic moats, generate massive profits, and always have demand for their shares when the stocks go on sale. That makes them terrific adds to a portfolio and right now, buying consumer-focused brands is likely the least crowded trade in markets.

BE A CONTRARIAN

Disclosure: The above data is for illustrative purposes only.  This information was produced by Accuvest and the opinions expressed are those of the author as of the date of writing and are subject to change. Any research is based on the author’s proprietary research and analysis of global markets and investing. The information and/or analysis presented have been compiled or arrived at from sources believed to be reliable, however the author does not make any representation as their accuracy or completeness and does not accept liability for any loss arising from the use hereof. Some internally generated information may be considered theoretical in nature and is subject to inherent limitations associated therein. There are no material changes to the conditions, objectives or investment strategies of the model portfolios for the period portrayed. Any sectors or allocations referenced may or may not be represented in portfolios managed by the author, and do not represent all of the securities purchased, sold or recommended for client accounts.  The reader should not assume that any investments in sectors and markets identified or described were or will be profitable. Investing entails risks, including possible loss of principal. The use of tools cannot guarantee performance. The charts depicted within this presentation are for illustrative purposes only and are not indicative of future performance. Past performance is no guarantee of future results.

Thematic Investing Can Add a Ton of Value to Portfolios

Key Summary:

  • Earnings season has begun, we have some solid reports across the brands universe.
  • Streaming video & entertainment has become a consumer staple. Netflix wins.
  • In the asset management industry, private markets are where the information advantages are real. Blackstone wins.

Very Important thesis: If equities generate roughly ~10-11% a year over time, leading brands, dominant global franchises, particularly those serving the dominant driver of the economy, in theory, should compound at 13-15%+ over time. In a world where rates and inflation will likely trend higher for longer, business models with pricing power, exposure to quality factors, and that generate strong profits and free cash are set up to win versus broad markets. Brands Matter.

Earnings Season Has Begun. Here’s a few portfolio brands executing well.

I love earnings season. Each quarterly report is a new piece of the puzzle, and it lets us know what management teams are thinking about their respective businesses, industries, and the economy in general. Remember, our investment in stocks is a De facto vote of confidence on the economies in which we invest. Earnings, revenue, margins, free cash flow, and the growth of these important metrics is what drives stocks up or down over time. As someone who invests but also likes to actively trade when markets act irrational, earnings season tends to offer some wonderful tactical trading opportunities along with offering great, long-term information for buy-hold investors. The next few notes, I’ll discuss some earnings reports and secular themes we are very excited about for the future.

Image created in 10 seconds using AI via ChatGPT. Very cool!

Netflix: NFLX

Remember when the cable industry was one of the most stable and predictable industries?

Legacy media brands sat by and let a new company, Netflix carve out a new market and take market share slowly, then all at once. Fast forward to today, Netflix is now the new cable and the first place most consumer begin their entertainment and content search. This nuance is a massive behavioral moat for Netflix, and I never hear anyone talking about it. Netflix reported a strong and stable quarter on October 17th and the stock is +10% on the 18th, last I checked. Here’s why we continue to like Netflix and why it’s a core holding as a dominant Mega Brand and a consumer staple.

The Report & Our View of the Stock:

Lots of growth potential around the world. 283 million paid subscribers headed much higher over time. Q3, revenue +15% YOY, operating margins 30% vs 22% last year. For Q4, they forecast 15% revenue growth and expect paid net additions to be higher than this quarters 5.1M sub growth. For 2025, they forecast revenue of $43-44B which is +11-13% growth, slower than 2024 but we expected this to moderate as password sharing opportunities diminish. Margins should continue to rise over time as content spend stays stable and revenue and free cash flow expand. And make no mistake, Netflix has solid pricing power to raise prices and drive more ad-tier subs. This business has become a solid consumer staple that adds significant value to a consumer’s life as a primary entertainment provider. The low cost of the service keeps churn low and engagement solid. Live sports and sports-related content will continue to grow bringing in new entrants. NFLX had the benefit of building a massive library of content fueled by debt when rates were largely at ZERO while peers in the industry sat idle and watched NFLX take their businesses. Now they are scrambling to compete in a world with much higher cost of capital and higher content costs. All in all, Netflix offers one of the best value propositions to consumers, has become THE place consumers start their content and entertainment searches which keeps churn low and pricing power high. This is a very powerful flywheel that grows over time with new and intriguing content added.  Traditional consumer staples grow much less, do not generate this kind of profitability and margins and trade at the same multiple or higher as Netflix. More and more, consumer staple brands do not just live in the staples sector. With technology at the center of our lives, there are plenty of tech staples located in plain sight. Yes, tech and communication services stocks can be volatile, but just because their stock can be volatile, do not assume their business is volatile so when these staples go on sale, they are wonderful buying opportunities.

Blackstone: BX

The democratization of alternatives via private market access continues. Blackstone is the largest alternative asset manager on the planet at $1.1Trillion and growing assets at a rapid clip. The crazy part: there is so much room for growth ahead, particularly in the wealth management industry as most HNW investors have very little exposure overall. Here’s a crazy truth: these stocks are very under-owned and underrepresented in indexes, ETF’s, and active funds. And they have been massive alpha generators over the S&P 500. Apollo still needs to be added to the S&P and it’s a matter of WHEN, not IF.

The Brands portfolio owns a basket of the leaders because the secular growth opportunity remains enormous. Blackstone, KKR, Apollo and these brands are the smartest investors around the globe, have massive access to capital in good times and bad, have a wicked information advantage because they each own hundreds of private companies that give them the ability to look around corners for future trends. And they have hundreds of billions in dry powder to buy assets when they go on sale. No matter what the calamity, these great investors always seem to find a way to capitalize on turmoil. Stable, attractive performance just drives more asset flows which drives higher fee revenue which drives the stocks higher.

Like Netflix, the alts business is a wonderful flywheel and the benefits compound over time at scale. Just remember, these stocks can be volatile at times, so you often get a chance to buy them on dips. We love to hold the core position and trade around the position, using the vol to our advantage.

The Report & Our View of the Stock:

Overall, a solid quarter with solid trends for a good 2025. Massive $40.5B new flows this quarter dominated by private credit & insurance but good overall flows into Infrastructure, core PE, plus good fund raising in other real estate and opportunistic credit funds. Management fees $1.7B. Deployed $34B broadly across credit, PE, RE but credit was the big deployment area. Performance stable and solid across fund verticals, with real estate slowly recovering.  $1.17T in assets with $171B in dry powder, so they have massive opportunities to put a lot of money to work over time and to generate solid fees that grow over time. 2025 is expected to show better realizations, and deployments as M&A heats up and sentiment gets better leading to more deals. Their deployments continue to be focused on data centers globally, AI, software, life sciences, and shelter opportunities along with renewables and energy. All of which tend to be solid inflation beneficiaries as rates are expected to stay elevated with elevated inflation.

Image created in 10 seconds using AI via ChatGPT.

Disclosure: The above data is for illustrative purposes only.  This information was produced by Accuvest and the opinions expressed are those of the author as of the date of writing and are subject to change. Any research is based on the author’s proprietary research and analysis of global markets and investing. The information and/or analysis presented have been compiled or arrived at from sources believed to be reliable, however the author does not make any representation as their accuracy or completeness and does not accept liability for any loss arising from the use hereof. Some internally generated information may be considered theoretical in nature and is subject to inherent limitations associated therein. There are no material changes to the conditions, objectives or investment strategies of the model portfolios for the period portrayed. Any sectors or allocations referenced may or may not be represented in portfolios managed by the author, and do not represent all of the securities purchased, sold or recommended for client accounts.  The reader should not assume that any investments in sectors and markets identified or described were or will be profitable. Investing entails risks, including possible loss of principal. The use of tools cannot guarantee performance. The charts depicted within this presentation are for illustrative purposes only and are not indicative of future performance. Past performance is no guarantee of future results.


Investing in Big Rivers is a No-Brainer, Common Sense Decision.

Key Summary:

  • There is no other broad market theme bigger than global consumer spending.
  • The easiest and most defendable allocation decision is to add consumer exposure.
  • The equal-weight Consumer Discretionary basket continues to outperform Staples.

Very Important thesis: If equities generate roughly ~10% a year over time, leading brands, dominant global franchises, particularly those serving the dominant driver of the economy, in theory, should compound at 13-15%+ over time. In a world where rates and inflation will likely trend higher for longer, business models with pricing power, exposure to quality factors, and that generate strong profits and free cash are set up to win versus broad markets. Brands Matter.

Don’t Ignore a $50+ Trillion Theme in Your Portfolio.

The U.S. is a roughly $28 trillion economy and a leader in innovation across sectors. Thank heavens the bulk of our portfolio is tied to the #1 economy in the world. Whether we realize it or not, our investment decisions and our home bias make us reliant on the U.S. economy. Staying up to speed on the core driver of the economy is a very important factor when managing U.S.-centric portfolios. Holding one or a few dedicated investments in this theme makes that easier. As I’ve written many times, our economy is consumer-spending focused. Spending on needs and wants is in our DNA which makes investing in this theme not only logical but highly profitable. One belief I have stated over and over: If the S&P 500 returns about 10% long-term, the best companies, the dominant franchises operating across important industries should compound greater than the market overall. It’s these companies where our team focuses 100% of our time. I used the +13-15% annual returns as an internal benchmark for leading brands over full market cycles. This is what we should expect and what the data has shown long-term.

The chart below simplifies the opportunity for investors by showing how important the consumption component of GDP is in America. Retail Sales alone is about $7 trillion a year. Consumers spend across a variety of “needs” categories as well as “wants” categories. We invest in leading brands across both needs and wants. Additionally, we are a service economy so roughly two-thirds of GDP comes from services and small businesses. Fun fact, household consumption drives every major economy making a global brands allocation an easy core equity choice for allocators. The consumption in the U.S. accounts for about $18.9 trillion per Morgan Stanley and it grows 2-3% each year with alarming predictability. Even a global pandemic cannot stop us consuming for very long. Just to put an exclamation point on this statement, very few investors have sufficient exposure to the brands dominating across important consumption categories. ETF’s are under-exposed, active funds are under-exposed, and retail investors who chase momentum in tech are wildly under-exposed to iconic consumer brands. That’s the opportunity. Adding important exposure to stocks that are superior operators, have global sales opportunities, and have stellar long-term track records is an easy decision.

Market Health Update: Discretionary is Outperforming Staples (defensives).

Most investors invest in sectors via ETF’s and funds. It’s important to compare the major ETF’s and market cap weighted strategies with equal-weighted strategies because sometimes, the most popular ETF does not tell the whole story in a sector. Monitoring the equal-weighted indices across discretionary & staples is vital to understanding the strength or weakness underlying the real economy. Remember, having this knowledge will help you across all the investments you hold given how reliant everything is to our economy.

The discretionary sector struggled as did all growth and quality-oriented areas of the market in 2022. That was a classic re-set and a raging opportunity to add exposure. About mid-year 2022, something happened, discretionary stocks vs staples stopped underperforming and began to outperform. This tends to happen after big market dislocations, beta begins to outperform low vol. The chart below shows a ratio chart of the equal-weight discretionary vs staples performance. When the line is rising, discretionary stocks are outperforming defensives. The rising line highlights the markets appetite for risk-taking and the overall health of the economy. For now, it’s clearly saying more positive things than you might hear from the media.

Market-Cap Weighted Investments Are Masking Underlying Strength.

Important: most assets across all sectors and index investments are invested in market-cap weighted strategies. That’s been helpful at the index level and has led investors astray when analyzing the consumer stocks. Here’s how the market-cap weighted sector strategies look vs the bullish equal-weighted ones. The chart shows discretionary stocks still under a downtrend but threatening to break over the downtrend.

If I saw this chart and it was a stock, I would say the direction is inconclusive until a clean break of the downtrend line has been accomplished. Clearly, this chart tells a different story than the one above which screams, offense over defense generally across consumer stocks. Both are performing but one is performing better than the other.

SUMMARY:

The over-arching message these ratio charts are telling us: broadly, the consumer stocks are performing better than defensive staples which remains a bullish sign for the U.S. economy and therefore equity markets today. And remember, algorithms and zero-days to expiration index options drive daily market volume so if you are engaged in equities, you must absorb the daily volatility they create. We like to use this volatility to our advantage with fast-twitch active trading when we see the opportunity, which offers a unique and differentiated edge in today’s volatile world.

A reminder about our approach: 1) Offense (discretionary, tech, communication services, and alternative asset managers), 2) Defense (staples, healthcare, holding excess cash), and 3) Special teams (active, fast-twitch trading which can offer multiple years of a company dividend in less than 30 days of risk exposure when executed properly).

Disclosure: The above data is for illustrative purposes only.  This information was produced by Accuvest and the opinions expressed are those of the author as of the date of writing and are subject to change. Any research is based on the author’s proprietary research and analysis of global markets and investing. The information and/or analysis presented have been compiled or arrived at from sources believed to be reliable, however the author does not make any representation as their accuracy or completeness and does not accept liability for any loss arising from the use hereof. Some internally generated information may be considered theoretical in nature and is subject to inherent limitations associated therein. There are no material changes to the conditions, objectives or investment strategies of the model portfolios for the period portrayed. Any sectors or allocations referenced may or may not be represented in portfolios managed by the author, and do not represent all of the securities purchased, sold or recommended for client accounts.  The reader should not assume that any investments in sectors and markets identified or described were or will be profitable. Investing entails risks, including possible loss of principal. The use of tools cannot guarantee performance. The charts depicted within this presentation are for illustrative purposes only and are not indicative of future performance. Past performance is no guarantee of future results.