Stability in Chaos: The Market Moves Forward Despite Global Tensions
Explore Catalyst Funds | Explore Rational Funds
The Macro View: Volatility, Tariffs, and Fed Jitters
By David Miller, Co-Founder and Chief Investment Officer, Catalyst Capital Advisors LLC and Rational Advisors, Inc.
As we begin Q3 2025, the investing landscape continues to be shaped by three dominant macro forces: persistent trade tensions, evolving interest rate policy, and slowing global growth expectations.
Markets entered July still recovering from the tariff-driven dislocation that rattled Q2. While the worst fears of an all-out global trade war have not materialized, tariff escalation with China, Canada, and Mexico remains a live risk. Investors are weighing the paradoxical potential for a “tariff recession” to catalyze Fed rate cuts—an echo of what we saw in 2020. In fact, markets now price in two 25 bps cuts by year-end, even as inflationary impulses remain stickier than expected due to supply chain shocks and deficit spending.
Key Signals to Watch in Q3:
- Federal Reserve Policy: After holding steady in Q2, markets expect clearer dovish signaling at the upcoming August Jackson Hole symposium and the September FOMC meeting.
- GDP Trajectory: Q1 GDP showed a deceleration. It is an open-ended question as to the direction of the trajectory going forward, but the new bill will likely be a stimulus.
- Consumer Confidence: Still fragile after a sharp Q2 drop, this remains a key sentiment barometer.
- Yield Curve Dynamics: The 2s/10s curve remains relatively flat in slope.
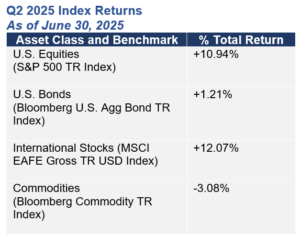
Source: Bloomberg & YCharts. From 3/31/25 to 6/30/25.
Mr. Miller is a portfolio manager for the Catalyst Systematic Alpha Fund (ATRFX), Catalyst Insider Buying Fund (INSIX), Catalyst Insider Income Fund (IIXIX), Rational Strategic Allocation Fund (RHSIX) and the Strategy Shares Gold Enhanced Yield ETF (GOLY).
Equity Markets: A Q2 Comeback, but Volatility Remains the Name of the Game
By Michael Dzialo, Karen Culver, Peter Swan, Zachary Fellows, John Dalton, and Nicolas Vilotti of the Managed Asset Portfolios Investment Team.
Investors would not know it from the slight gains in the broader market so far this year, but volatility has been the defining term for the first half of 2025. In fact, a recent Barron’s article mentioned that, on a risk-adjusted basis, returns for the S&P 500 this year have been in the 24th percentile since 1990, while volatility has been in the 89th percentile. Now, more so than ever, the broader markets react to headlines and tweets rather than facts and figures.
U.S. stocks fell in the first quarter after two consecutive years of gains amid rising policy uncertainty in Washington, marking the worst relative performance for U.S. stocks versus global markets in 23 years. Fast forward to the second quarter, and U.S. stocks rebounded following Liberation Day lows as global stocks treaded water. As we move into the third quarter, the same uncertainties that plagued the U.S. market in the first half of the year remain, including valuations, global macroeconomic activity, interest rates, and tariffs.
Despite the volatility this year, the S&P 500 is trading at 25.8 times trailing earnings, above the 5 and 10-year averages of 23.87 and 21.68, respectively. This compares to the MSCI ACWI ex-USA, trading at 15.92 times trailing earnings, slightly below the 5 and 10-year averages of 16.42 and 16.26, respectively. U.S. stocks have historically commanded premium valuations over most other countries for several reasons; however, we believe the delta between the two is too wide. Elevated valuations need the support of continued earnings growth. Companies reported decent earnings growth in the first quarter, yet many either pulled guidance for the rest of the year or issued softened guidance in the face of economic uncertainty.
Assessing the Health of the U.S. Economy
The U.S. economy has demonstrated remarkable resilience in 2025, but cracks are beginning to form. Our investment team is closely watching the labor market as layoffs rise, and recent college graduates are having difficulty finding a job. As such, we have a cautious view on the U.S. economy. At its most recent meeting, the Federal Reserve (the “Fed”) lowered its 2025 GDP forecast to 1.4% from 1.7% while raising its forecast for core inflation to 3.1% from 2.8% in anticipation of a tick up in inflation in the coming months stemming from tariffs. Eventually, we believe the Fed will succumb to political pressure and, as the economy slows, lower interest rates, further steepening the yield curve. Either way, Fed Chair Jerome Powell’s term ends in May 2026, and whoever President Trump selects to succeed him will likely share his views that the Fed needs to lower rates.
While U.S. investors grapple with uncertainty, markets outside the U.S. appear well-positioned over the long-term. We believe that U.S. trade policies should become catalysts to push foreign nations to spend more on infrastructure and defense. As we have witnessed in the U.S. over the past several decades, spending money is stimulative to the economy. We believe Europe may be in the preliminary stages of a substantial economic rebound as spending increases.
Why Investors Should Consider a Global, Active Approach
Overall, we believe an environment of heightened geopolitical and economic uncertainty strengthens the case for active management. While we monitor, we do not act on the seemingly daily barrage of tweets and headlines coming out of Washington. Rather, we look at the bigger picture. The investment team believes the U.S. dollar will trend lower over the next few years, not necessarily in a straight line, benefiting global equities as well as select commodities. We are also overweight those sectors that historically do not rely on strong economic growth, including the Consumer Staples, Health Care, and Utilities sectors.
Managed Asset Portfolios sub-advises the Catalyst/MAP Global Equity Fund (CAXIX) and the Catalyst/MAP Global Balanced Fund (TRXIX).
Fixed Income Outlook: Bond Markets & Murphy’s Law
By Michael Perini, Perini Capital LLC.
Murphy’s Law stating “what can go wrong will go wrong” seems like an apt description of life for fixed income investors since the beginning of 2022. Since then, investors in the asset class have had to grapple with the following:
- Multi trillion dollar increases in the Federal Reserve’s balance sheet.
- Fiscal stimulus and budget deficits that are more in line with wartime or deep recessions.
- Inflation that has not been seen since the 1970’s.
- An increase in the Federal Funds rate from 0.25% to 5.50%.
- Tariffs and the uncertainty associated with them.
- Decreased demand for U.S. Treasuries.
- Renewed conflict in the Middle East.
- The “Big Beautiful Bill”
However, perhaps the problems are not what they seem when viewed through a different lens. Maybe what fixed income investors need is a paradigm shift. While all the above-mentioned headwinds make it seem like it may be time to reduce exposure to fixed income, we disagree because of our non-traditional way of viewing the risks associated with fixed income.
In our view, there are three distinct risks to fixed income investors:
- Interest Rate Risk: The risk that interest rates rise.
- Reinvestment Risk: The risk that interest rates fall.
- Credit Risk: The risk of permanent impairment of capital due to defaults.
The events beginning in 2022 and continuing through today have been extremely painful from the standpoint of investors with significant interest rate risk. Interest rates have gone up (a lot!) and prices have gone down. From the standpoint of reinvestment risk, the interest rate environment since 2022 has been a big positive, as the reinvestment rate of incoming cash flows is much higher than it was prior to 2022. The reinvestment component of total return is often underappreciated, both as a counterweight to interest rate risk and as a key in creating return stability to a variety of forward interest rate scenarios. However, achieving this balance is not easy, nor is it often accessible via traditional fixed income solutions.
Traditional fixed income solutions, such as U.S. Treasuries, corporate bonds and municipal bonds, pay interest every six months and principal as a final payment at maturity; therefore, due to the lack of cash flow between issuance and maturity, the reinvestment rate of incoming cash flows is typically not a meaningful component of total return. In contrast, structured credit sectors, such as mortgage-backed-securities, often pay interest and principal every month, and because of this feature the reinvestment of incoming cash flows is generally a meaningful component of total return. Additionally, the higher the cash flow of a portfolio the lower price changes (because of changing rates) matter as a percentage of total return.
Given the uncertainty in today’s macro environment where interest rate volatility and direction will likely remain high and difficult to forecast, we believe investors should look to alternative fixed income solutions that can provide non-correlated returns, diversification and balance interest rate risk versus reinvestment risk. The paradigm shift mentioned herein has the potential to benefit investors when navigating the fixed income markets through the rest of 2025 and beyond.
Perini Capital LLC is the sub-advisor to the Catalyst/Perini Strategic Income Fund (CSIOX)
Spotlight: Why Gold Continues to Shine
By David Miller, Co-Founder and Chief Investment Officer, Catalyst Capital Advisors LLC and Rational Advisors, Inc.
Gold remains a standout asset class as we enter Q3—offering both a potential hedge against geopolitical chaos and an escape from fiat currency erosion. A few key reasons:
- Central Bank Demand Surging: BRICS nations—particularly China and India—are accelerating gold reserves accumulation as part of broader de-dollarization strategies.
- Deficits + Tariffs = Inflation Risk: Persistent U.S. fiscal deficits, now exacerbated by tariff-induced price pressures, add to the long-term inflation argument—which is generally supportive of gold prices.
- Yield Convergence: With bond yields declining and real rates pressured by inflation, the opportunity cost of holding gold is falling—reviving investor interest in gold ETFs and alternatives.
- Technical Breakout: Gold has held above $3,250/oz for much of June and shows signs of an upward breakout as volatility returns to equity markets.
Positioning Implications:
We believe that the current macro environment justifies a meaningful allocation to gold and gold-related strategies.
Looking ahead, the combination of fragile equity sentiment, uncertain policy direction, and structural macro headwinds reinforces our view: gold isn’t just a crisis hedge—it’s becoming a core asset class in the modern portfolio playbook.
IMPORTANT DISCLOSURES
Past performance is not a guarantee of future results.
INVESTORS SHOULD CAREFULLY CONSIDER THE INVESTMENT OBJECTIVES, RISKS, CHARGES AND EXPENSES OF LIQUID ALTERNATIVE FUNDS, INCLUDING THE CATALYST FUNDS AND THE RATIONAL FUNDS. THIS AND OTHER IMPORTANT INFORMATION ABOUT A FUND IS CONTAINED IN THE PROSPECTUS, WHICH CAN BE OBTAINED BY CALLING 866-447-4228 OR AT WWW.CATALYSTMF.COM OR WWW.RATIONALMF.COM, AS APPLICABLE. THE RELEVANT PROSPECTUS SHOULD BE READ CAREFULLY BEFORE INVESTING. BOTH THE CATALYST FUNDS AND THE RATIONAL FUNDS ARE DISTRIBUTED BY NORTHERN LIGHTS DISTRIBUTORS, LLC (“NLD”). NLD HAS HAD NO ROLE IN THE STRUCTURING OR DISTRIBUTION OF ANY OTHER INVESTMENT PRODUCTS REFERENCED HEREIN, AND IS NOT RESPONSIBLE FOR THE MARKETING OR PROMOTIONAL MATERIAL RELATED TO THE OTHER INVESTMENT PRODUCTS PRODUCED OR SPONSORED BY ANY OTHER FIRM. DAVID MILLER, STRATEGY SHARES, MICHAEL DZIALO, KAREN CULVER, PETER SWAN, ZACHARY FELLOWS, JOHN DALTON, NICOLAS VILOTTI, MANAGED ASSET PORTFOLIOS, MICHAEL PERINI, AND PERINI CAPITAL LLC ARE NOT AFFILIATED WITH NLD.
Risk Considerations
Though the objectives, strategies and assets traded may differ significantly across liquid alternative approaches, investing in liquid alternatives generally carries certain risks. These risks may include, but are not necessarily limited to, the following: Certain funds may invest a percentage of their assets in derivatives, such as futures and options contracts. The use of such derivatives and the resulting high portfolio turn-over may expose such funds to additional risks that they would not be subject to if they invested directly in the securities and commodities underlying those derivatives. These funds may experience losses that exceed those experienced by funds that do not use futures contracts, options and hedging strategies. Investing in commodities markets may subject a fund to greater volatility than investments in traditional securities. Currency trading risks include market risk, credit risk and country risk. Foreign investing involves risks not typically associated with U.S. investments. Changes in interest rates and the liquidity of certain investments could affect a fund’s overall performance. Other risks include U.S. Government securities risks and investments in fixed income securities. Typically, a rise in interest rates causes a decline in the value of fixed income securities or derivatives owned by a fund. Furthermore, the use of leverage can magnify the potential for gain or loss and amplify the effects of market volatility on a fund’s share price. All funds are subject to regulatory change and tax risks; changes to current rules could increase costs associated with an investment in a fund.
The value of a fund may decrease in response to the activities and financial prospects of an individual security or group of securities held in a fund’s portfolio. Investments in foreign securities could subject a Fund to greater risks, including currency fluctuation, economic conditions, and different governmental and accounting standards. A fund’s portfolio may be focused on a limited number of industries, asset classes, countries or issuers. Certain funds may invest in high yield or junk bonds, which present a greater risk than bonds of higher quality. Other risks may include credit risks and interest rate risk, particularly with respect to floating rate loan funds. Changes in short-term market interest rates will directly affect the yield on the shares of a fund whose investments are normally invested in floating rate debt. Floating rate loan funds tend to be illiquid, and a fund might be unable to sell the loan in a timely manner as the secondary market is generally a private, unregulated inter-dealer or inter-bank re-sale market.
Any or all of the foregoing risk factors may affect the value of your investment.
The views expressed herein are as of June 30, 2025, and represent a general guide to the perspectives of the authors. The information and opinions contained in this document have been compiled or arrived at based on sources believed to be reliable and in good faith; however, no representations or warranties of any kind are intended or should be inferred with respect to the accuracy of the information contained herein or the economic return of an investment in a fund, and no assurance can be given that existing laws will not be changed or interpreted adversely. All such information and opinions are subject to change without notice.
Some of the statements in this presentation may contain or be based on forward looking statements, estimates, targets or prognoses (collectively, “forward looking statements”), which reflect the advisor’s current view of future events, economic developments and financial performance. Such forward looking statements are typically indicated by the use of words which express an estimate, expectation, belief, target or forecast. Such forward looking statements are based on an assessment of historical economic data, on the experience and current plans of the advisor and/or certain of its advisors, and on the indicated sources. These forward looking statements contain no representation or warranty of whatever kind that such future events will occur or that they will occur as described herein, or that such results will be achieved by any fund or the investments of any fund, as the occurrence of these events and the results of a fund are subject to various risks and uncertainties. The actual portfolio, and thus results, of a fund may differ substantially from those assumed in the forward looking statements. The opinions expressed reflect the advisor’s best judgment at the time this presentation was issued, and the advisorr and its affiliates will not undertake to update or review the forward looking statements contained in this presentation, whether as a result of new information or any future event or otherwise.
The advisor’s judgments about the growth, value or potential appreciation of an investment may prove to be incorrect or fail to have the intended results, which could adversely impact a Fund’s performance and cause it to underperform relative to other funds with similar investment goals or relative to its benchmark, or not to achieve its investment goal.
There is no assurance that these opinions or forecasts will come to pass, and past performance is no assurance of future results.
There is a risk that issuers and counterparties will not make payments on securities and other investments.
Glossary:
Bloomberg Commodity TR Index – designed to be a highly liquid and diversified benchmark for commodity investments.
Bloomberg US Aggregate Bond TR Index – A market capitalization-weighted index that is designed to measure the performance of the U.S. investment grade bond market with maturities of more than one year.
BRICS – an intergovernmental organization comprised of ten countries: Brazil, Russia, India, China, South Africa, Egypt, Ethiopia, Indonesia, Iran and the United Arab Emirates.
Commodities – a basic good used in commerce that is interchangeable with other commodities of the same type. Investors and traders can buy and sell commodities directly in the spot (cash) market or via derivatives such as futures and options.
Credit Spreads – The difference in yield (return) between two debt instruments of the same maturity but with different credit ratings, reflecting the additional risk investors take on when lending to a borrower with a lower credit rating.
Currencies – money in the form of paper and coins that’s used as a medium of exchange. Currencies are created and distributed by individual countries around the world.
MSCI EAFE Gross TR USD Index – a broad market equity index that tracks the performance of large and mid-cap companies in 21 developed markets around the world, excluding the US and Canada.
S&P 500 TR Index – A market capitalization-weighted index that is used to represent the U.S. large-cap stock market.
20250702-4633644
Click here to read the full report.
The Guide to Building a Risk Balanced Portfolio for Volatile Markets
Explore Catalyst Funds | Explore Rational Funds
Most investors intuitively understand the benefits of diversification, but due to a lack of familiarity and perceived complexity with other asset classes, many rely solely on stocks and bonds. As we’ve seen during recent market downturns, these two asset classes don’t always move independently, potentially undermining their ability to provide truly diversified returns.
In our recent report The Guide to Building a Risk Balanced Portfolio for Volatile Markets, we:
-
Introduce the liquid alternatives landscape
-
Explain how allocations to alts could have prevented downturns in past markets for some investors
-
Help investors understand how to diversify their portfolio using data-driven, time-tested approaches.
How Adding a Balanced Risk Strategy (Alternatives) Can Enhance a Portfolio
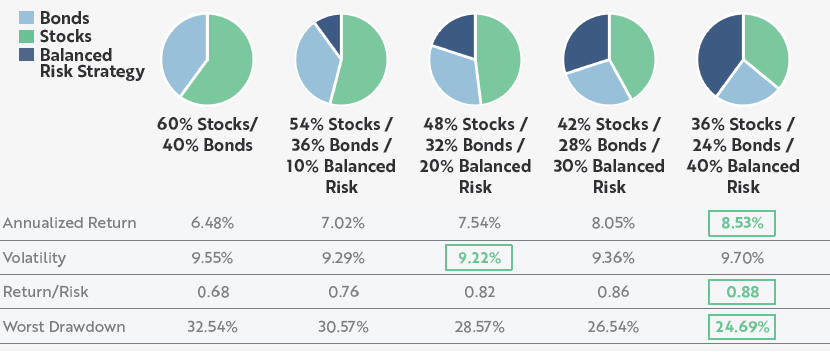 Data Source: Bloomberg LP and Catalyst Capital Advisors LLC. Based on monthly return data from 12/31/1999 to 12/31/2024. Stocks are represented by the S&P 500 TR Index; bonds are represented by the Bloomberg US Aggregate Bond Index; Balanced Risk Strategy is represented by 100% notional exposure to SG CTA Trend Index, 50% allocation to the S&P 500 and a 50% allocation to the Bloomberg US Short Treasury TR Index (to represent collateral for futures program). Rebalanced monthly. Past performance does not guarantee future results. See important disclosures at the end of this presentation, including with respect to the limitations inherent to hypothetical performance comparisons.
Click here to read the full report.
Chart of the Week: is the Stock Market Getting Ahead of Itself?
S&P 500 Cyclically Adjusted Price-to-Earnings Ratio (CAPE)
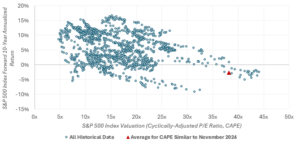
Even before November’s post-election rally, Wall Street was growing increasingly worried that the stock market was starting to get ahead of itself.
- In October, Goldman Sachs strategists cautioned investors to be prepared for stock market returns during the next decade that are toward the lower end of their typical performance distribution.
- As of November 11, 2024, the cyclically adjusted price-to-earnings ratio (or CAPE) hit a staggering 38.12x. Looking at these valuation levels going back to 1900, there has only been one instance where the S&P 500 produced a positive return in the following 10 years. In July 1998, the CAPE hit 38.26x and the 10-year return after was 0.84% annualized.
- S&P 500 10-year returns averaged -2.75% annualized following valuations like in November 2024.
Thematic Investing Can Add a Ton of Value to Portfolios
Key Summary:
- Earnings season has begun, we have some solid reports across the brands universe.
- Streaming video & entertainment has become a consumer staple. Netflix wins.
- In the asset management industry, private markets are where the information advantages are real. Blackstone wins.
Very Important thesis: If equities generate roughly ~10-11% a year over time, leading brands, dominant global franchises, particularly those serving the dominant driver of the economy, in theory, should compound at 13-15%+ over time. In a world where rates and inflation will likely trend higher for longer, business models with pricing power, exposure to quality factors, and that generate strong profits and free cash are set up to win versus broad markets. Brands Matter.
Earnings Season Has Begun. Here’s a few portfolio brands executing well.
I love earnings season. Each quarterly report is a new piece of the puzzle, and it lets us know what management teams are thinking about their respective businesses, industries, and the economy in general. Remember, our investment in stocks is a De facto vote of confidence on the economies in which we invest. Earnings, revenue, margins, free cash flow, and the growth of these important metrics is what drives stocks up or down over time. As someone who invests but also likes to actively trade when markets act irrational, earnings season tends to offer some wonderful tactical trading opportunities along with offering great, long-term information for buy-hold investors. The next few notes, I’ll discuss some earnings reports and secular themes we are very excited about for the future.

Image created in 10 seconds using AI via ChatGPT. Very cool!
Netflix: NFLX
Remember when the cable industry was one of the most stable and predictable industries?
Legacy media brands sat by and let a new company, Netflix carve out a new market and take market share slowly, then all at once. Fast forward to today, Netflix is now the new cable and the first place most consumer begin their entertainment and content search. This nuance is a massive behavioral moat for Netflix, and I never hear anyone talking about it. Netflix reported a strong and stable quarter on October 17th and the stock is +10% on the 18th, last I checked. Here’s why we continue to like Netflix and why it’s a core holding as a dominant Mega Brand and a consumer staple.
The Report & Our View of the Stock:
Lots of growth potential around the world. 283 million paid subscribers headed much higher over time. Q3, revenue +15% YOY, operating margins 30% vs 22% last year. For Q4, they forecast 15% revenue growth and expect paid net additions to be higher than this quarters 5.1M sub growth. For 2025, they forecast revenue of $43-44B which is +11-13% growth, slower than 2024 but we expected this to moderate as password sharing opportunities diminish. Margins should continue to rise over time as content spend stays stable and revenue and free cash flow expand. And make no mistake, Netflix has solid pricing power to raise prices and drive more ad-tier subs. This business has become a solid consumer staple that adds significant value to a consumer’s life as a primary entertainment provider. The low cost of the service keeps churn low and engagement solid. Live sports and sports-related content will continue to grow bringing in new entrants. NFLX had the benefit of building a massive library of content fueled by debt when rates were largely at ZERO while peers in the industry sat idle and watched NFLX take their businesses. Now they are scrambling to compete in a world with much higher cost of capital and higher content costs. All in all, Netflix offers one of the best value propositions to consumers, has become THE place consumers start their content and entertainment searches which keeps churn low and pricing power high. This is a very powerful flywheel that grows over time with new and intriguing content added. Traditional consumer staples grow much less, do not generate this kind of profitability and margins and trade at the same multiple or higher as Netflix. More and more, consumer staple brands do not just live in the staples sector. With technology at the center of our lives, there are plenty of tech staples located in plain sight. Yes, tech and communication services stocks can be volatile, but just because their stock can be volatile, do not assume their business is volatile so when these staples go on sale, they are wonderful buying opportunities.
Blackstone: BX
The democratization of alternatives via private market access continues. Blackstone is the largest alternative asset manager on the planet at $1.1Trillion and growing assets at a rapid clip. The crazy part: there is so much room for growth ahead, particularly in the wealth management industry as most HNW investors have very little exposure overall. Here’s a crazy truth: these stocks are very under-owned and underrepresented in indexes, ETF’s, and active funds. And they have been massive alpha generators over the S&P 500. Apollo still needs to be added to the S&P and it’s a matter of WHEN, not IF.
The Brands portfolio owns a basket of the leaders because the secular growth opportunity remains enormous. Blackstone, KKR, Apollo and these brands are the smartest investors around the globe, have massive access to capital in good times and bad, have a wicked information advantage because they each own hundreds of private companies that give them the ability to look around corners for future trends. And they have hundreds of billions in dry powder to buy assets when they go on sale. No matter what the calamity, these great investors always seem to find a way to capitalize on turmoil. Stable, attractive performance just drives more asset flows which drives higher fee revenue which drives the stocks higher.
Like Netflix, the alts business is a wonderful flywheel and the benefits compound over time at scale. Just remember, these stocks can be volatile at times, so you often get a chance to buy them on dips. We love to hold the core position and trade around the position, using the vol to our advantage.
The Report & Our View of the Stock:
Overall, a solid quarter with solid trends for a good 2025. Massive $40.5B new flows this quarter dominated by private credit & insurance but good overall flows into Infrastructure, core PE, plus good fund raising in other real estate and opportunistic credit funds. Management fees $1.7B. Deployed $34B broadly across credit, PE, RE but credit was the big deployment area. Performance stable and solid across fund verticals, with real estate slowly recovering. $1.17T in assets with $171B in dry powder, so they have massive opportunities to put a lot of money to work over time and to generate solid fees that grow over time. 2025 is expected to show better realizations, and deployments as M&A heats up and sentiment gets better leading to more deals. Their deployments continue to be focused on data centers globally, AI, software, life sciences, and shelter opportunities along with renewables and energy. All of which tend to be solid inflation beneficiaries as rates are expected to stay elevated with elevated inflation.

Image created in 10 seconds using AI via ChatGPT.
Disclosure: The above data is for illustrative purposes only. This information was produced by Accuvest and the opinions expressed are those of the author as of the date of writing and are subject to change. Any research is based on the author’s proprietary research and analysis of global markets and investing. The information and/or analysis presented have been compiled or arrived at from sources believed to be reliable, however the author does not make any representation as their accuracy or completeness and does not accept liability for any loss arising from the use hereof. Some internally generated information may be considered theoretical in nature and is subject to inherent limitations associated therein. There are no material changes to the conditions, objectives or investment strategies of the model portfolios for the period portrayed. Any sectors or allocations referenced may or may not be represented in portfolios managed by the author, and do not represent all of the securities purchased, sold or recommended for client accounts. The reader should not assume that any investments in sectors and markets identified or described were or will be profitable. Investing entails risks, including possible loss of principal. The use of tools cannot guarantee performance. The charts depicted within this presentation are for illustrative purposes only and are not indicative of future performance. Past performance is no guarantee of future results.
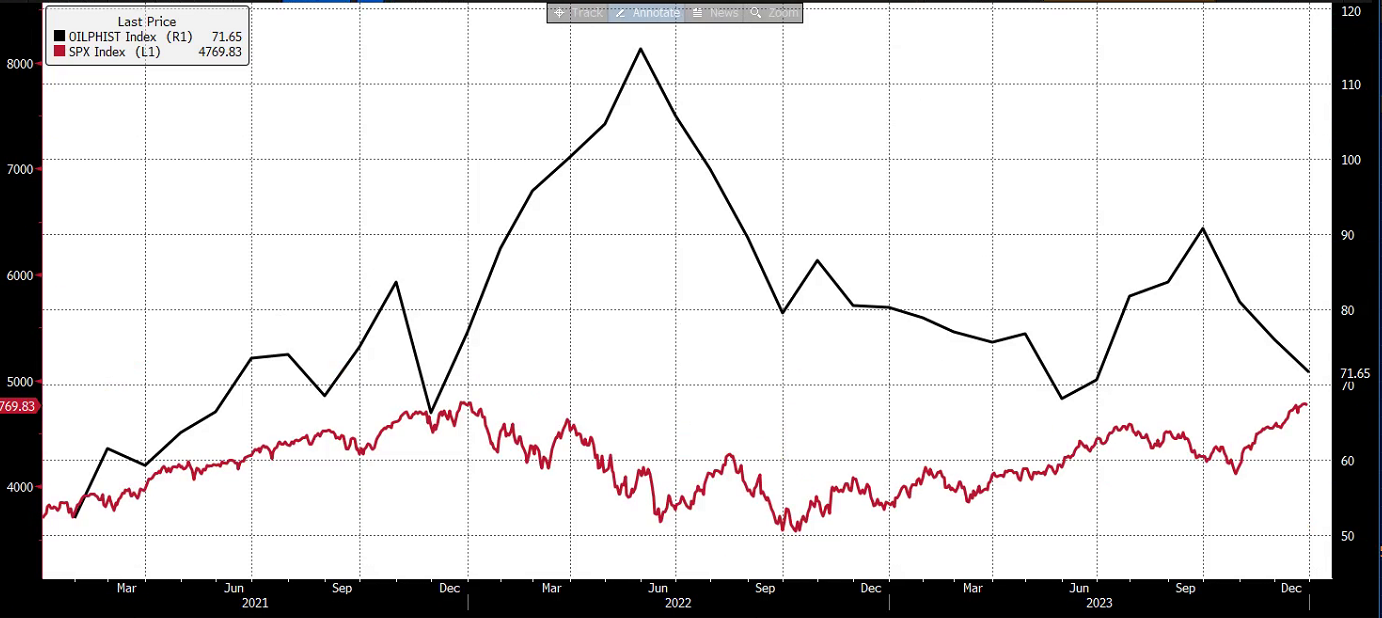
The Next Potential Volatility Explosion: Oil
Oil Shocks and Their Impact on the Stock Market: A Historical Overview
Oil shocks throughout history, whether caused by geopolitical conflicts or disruptions in production, have had significant effects on both the global economy and stock markets. Events like the 1973 Arab Oil Embargo and the 1979 Iranian Revolution led to sharp supply shortages, surging prices, and steep market declines, as economies struggled with inflation and stagnation. Similarly, more recent shocks, such as Iraq’s invasion of Kuwait in 1990 and Russia’s invasion of Ukraine in 2022, caused market volatility due to rising oil prices and global uncertainty. Understanding these historical patterns is crucial for portfolio managers seeking to mitigate risks during future oil disruptions.
By analyzing past oil shocks and market reactions, investors can better prepare for potential downturns and explore strategies to hedge against volatility. Maintaining a diversified portfolio and considering exposure to the energy sector are effective ways to navigate the unpredictability of global oil supplies.
Oil shocks, significant disruptions in the global oil supply that cause price spikes, have consistently influenced the stock market. Let’s delve into some major oil shocks and their market reactions:
1. 1973 Oil Crisis (Arab Oil Embargo)
- Cause: OPEC’s reduction of oil exports to the U.S. and allies in response to the Yom Kippur War.
- Impact: A 300% surge in oil prices, energy shortages, soaring inflation, and global recession.
- Market Reaction: Stock markets plummeted due to rising energy costs and economic uncertainty. Inflationary pressures, known as “stagflation,” led to a prolonged period of economic instability and market recovery.
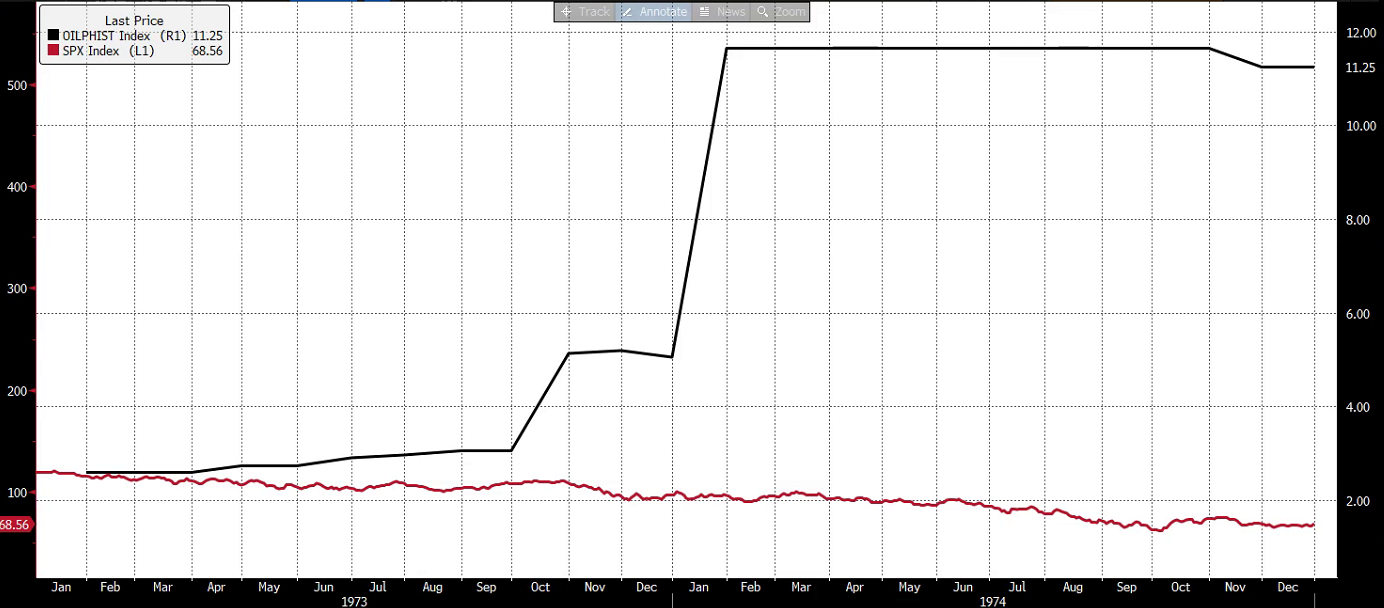
The 1973 oil crisis, triggered by OPEC’s reduction of oil exports in response to the Yom Kippur War, was a significant shock to the US economy. The oil price surge of 300% led to energy shortages, soaring inflation, and a global recession. The stock market experienced a near-50% decline, reflecting the widespread economic uncertainty. Today, a similar supply disruption localized to Iran might have a less severe impact due to increased energy diversification. However, a broader conflict involving other oil-producing states could escalate into a much larger supply shock, potentially leading to more significant economic consequences.
2. 1979 Oil Crisis (Iranian Revolution)
- Cause: Disruptions in Iranian oil production due to the revolution.
- Impact: A doubling of oil prices, high inflation, and economic stagnation.
- Market Reaction: Stock markets experienced another significant drop, further exacerbated by domestic inflation. Recovery was slow, with inflation persisting into the early 1980s.
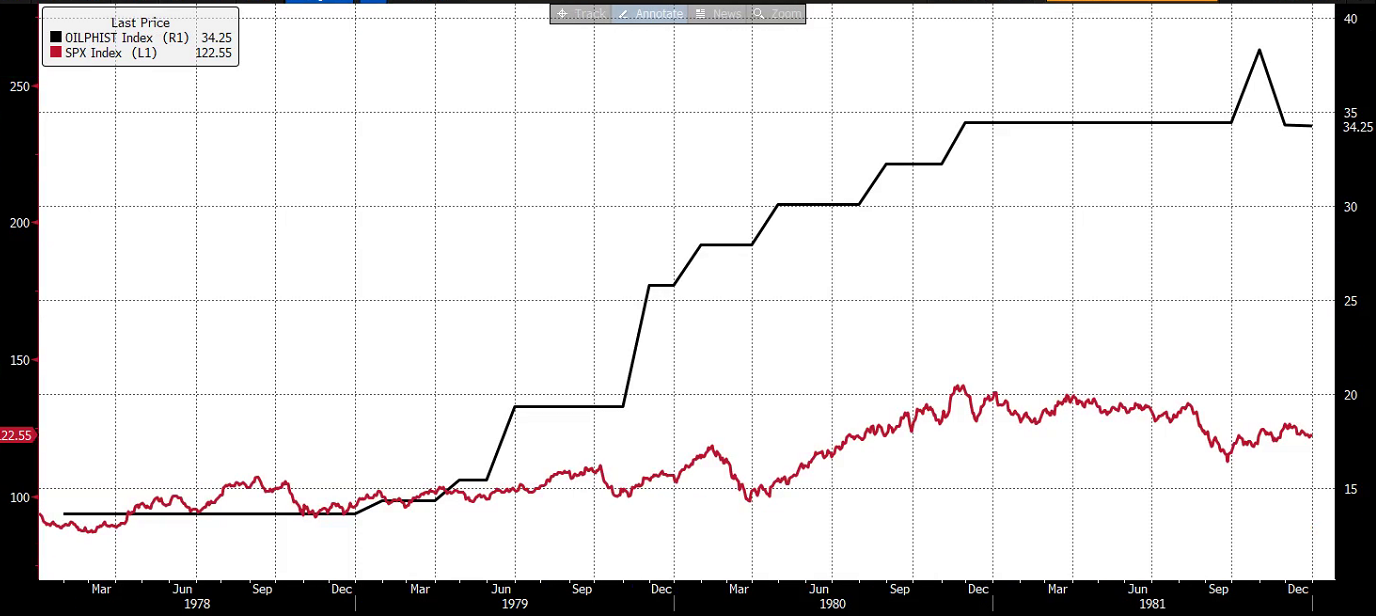
The 1979 oil crisis, caused by disruptions in Iranian oil production due to the revolution, led to a significant oil price spike, doubling prices and contributing to high inflation and economic stagnation. The stock market experienced a substantial decline, further exacerbated by domestic inflation. Recovery was slow, with inflation persisting into the early 1980s. Today, a similar supply shock originating from Iran could have a comparable impact. The 1970s were a volatile period, characterized by a struggling economy and a highly volatile stock market with multiple double-digit corrections. The introduction of Reaganomics, known for its tax cuts and deregulation policies, might also find parallels in today’s economic landscape.
3. 1990-1991 Gulf War (Iraq’s Invasion of Kuwait)
- Cause: Threats to oil production in a major oil-producing region.
- Impact: A temporary increase in oil prices, but less severe than previous crises.
- Market Reaction: A temporary decline in stock markets, followed by a relatively quick recovery. The economic damage was less pronounced.
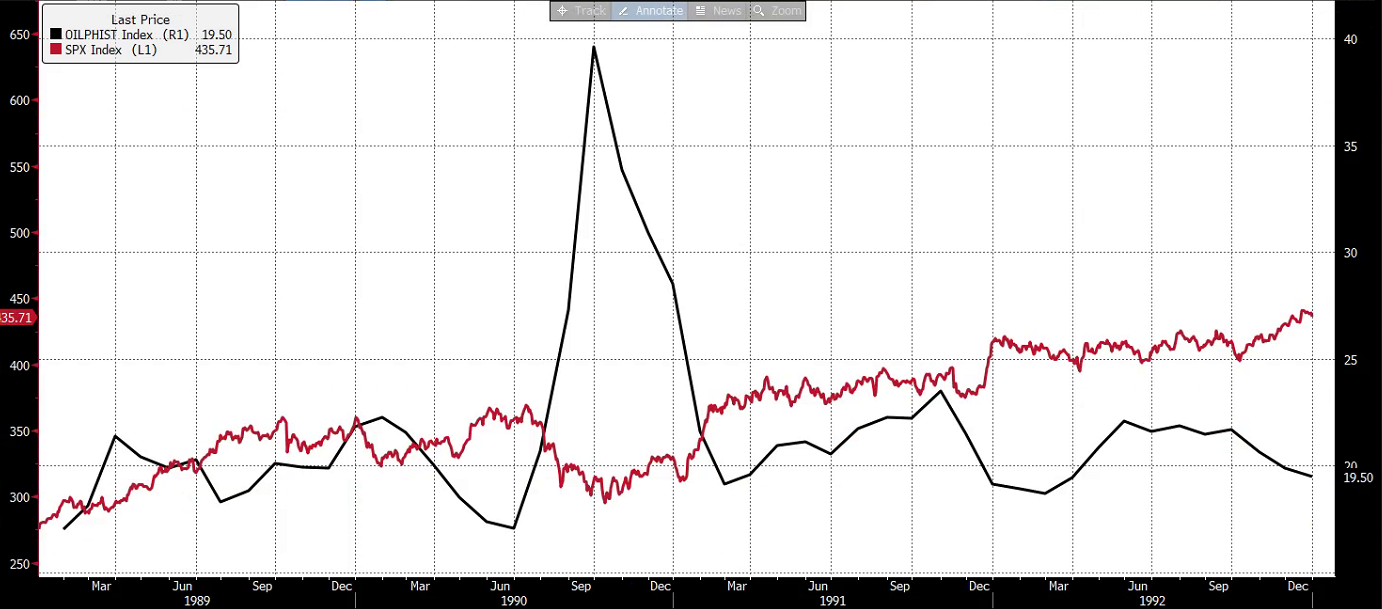
The 1990-1991 Gulf War, triggered by Iraq’s invasion of Kuwait, disrupted oil production in a major oil-producing region. This led to a temporary increase in oil prices, although less severe than the previous two crises. The stock market experienced a temporary decline, but recovered relatively quickly. The economic damage was less pronounced compared to the earlier oil shocks, despite the significant disruption in oil supply caused by the war.
4. 2008 Financial Crisis
- Cause: A global economic downturn triggered by the housing market collapse.
- Impact: Decreased oil demand and a temporary drop in oil prices.
- Market Reaction: A dramatic collapse in stock markets worldwide, with the oil sector hit hard. The market experienced a prolonged recovery with high volatility.
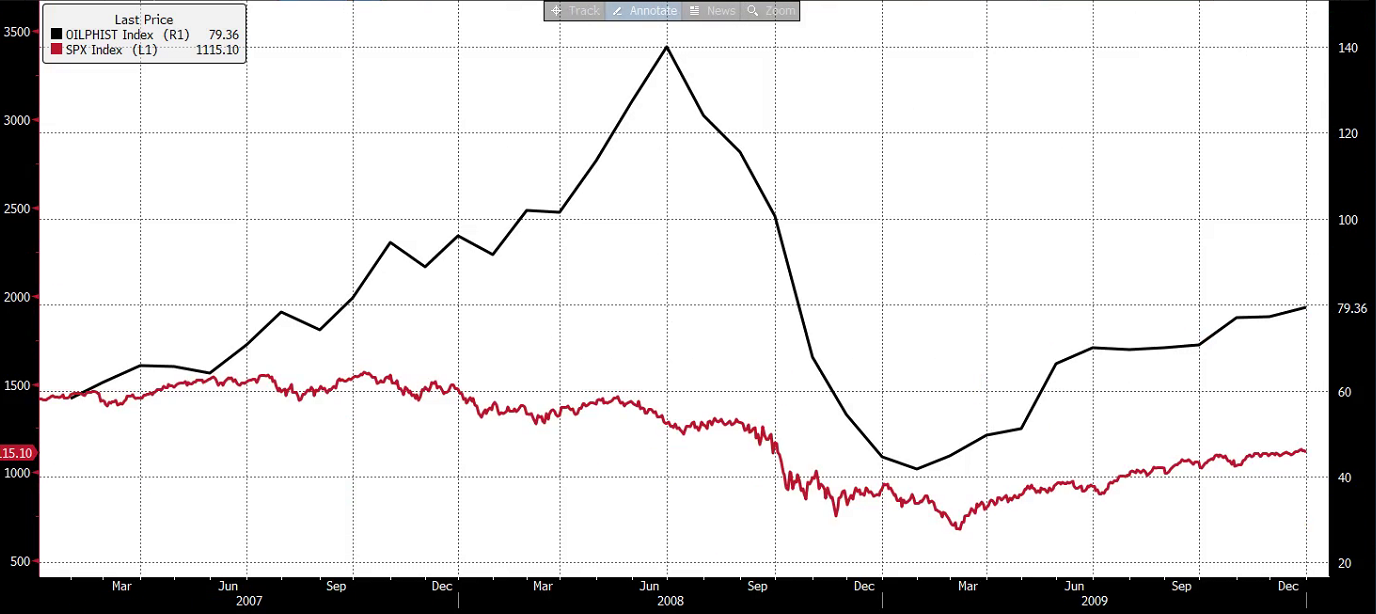
The 2008 financial crisis, triggered by the housing market collapse, represents a distinct departure from previous oil shocks. While there was no supply-driven disruption, the global economic downturn led to decreased oil demand. The oil sector was significantly impacted, and the stock market experienced a dramatic collapse. The unusual circumstances of the crisis, including the collapse of banks and disruptions in global trade, led to a prolonged period of market volatility and economic recovery.
A key factor contributing to the economic downturn was the sharp rise in oil prices during the early stages of the crisis. These elevated prices further exacerbated the economic weakness, creating a vicious cycle of rising costs and declining demand. Ultimately, the weak economy forced a decrease in oil demand, leading to a decline in oil prices.
While there were various factors influencing the oil price increase, including speculation and geopolitical tensions, the overall economic weakness played a significant role in driving prices down. This unique combination of circumstances made the 2008 oil shock distinct from previous events.
5. 2022 Russia-Ukraine War
- Cause: Sanctions on Russia, a major oil producer, following its invasion of Ukraine.
- Impact: A sharp rise in oil prices, increased inflation, and economic uncertainty.
- Market Reaction: Initial stock market declines due to fears of prolonged conflict, followed by volatility and a surge in energy sector stocks. The long-term impact remains uncertain.
The 2022 Russia-Ukraine War, marked by sanctions on Russia, a major oil producer, closely resembles the current economic landscape. The sharp rise in oil prices, reminiscent of previous oil shocks, has contributed to increased inflation and economic uncertainty. While the potential for increased US oil production could help mitigate price increases, the current situation has exacerbated an already challenging economic environment. Similar to past oil shocks, the rise in oil prices has contributed to higher inflation, leading to stock market declines.
Key Takeaways:
- Oil shocks can lead to significant short-term volatility and long-term economic impacts.
- The severity of market reactions varies based on the duration and magnitude of oil price spikes.
- Economic conditions, interest rates, and investor sentiment also influence stock market performance during oil shocks.
- Understanding the historical context of oil shocks can help investors better anticipate and navigate potential market disruptions.
While it may be tempting to increase our energy allocation in response to rising oil prices, it’s crucial to maintain a cautious approach. Predicting the future direction of oil prices is challenging, as various factors, including geopolitical events and global economic conditions, can influence supply and demand.
One potential scenario is an attack on Iran’s oil facilities, which could significantly disrupt global oil supply. However, it’s equally possible that the market is already anticipating such an event, leading to increased oil production elsewhere. This uncertainty highlights the importance of remaining flexible and prepared for potential volatility.
As a portfolio manager, it’s prudent to maintain our appropriate allocations while incorporating additional volatility measures. By remaining diversified and considering potential market swings, we can better manage risk and position our portfolio for long-term success.
Navigating the Rate Cut: A Guide for Advisors
Introduction
The ongoing Federal Reserve cycle has sparked intense debate regarding its resemblance to the 2007 and 1998 financial crises. While a definitive answer remains elusive, the devil is indeed in the details. The current economic landscape shares similarities with both 2007 and 1998, but the specific outcomes remain uncertain. The stark contrast between the record-breaking stock market of 1998 and the near-50% decline in 2007 underscores the importance of discerning the underlying factors driving each crisis. However, one consistent element across these periods is the rise in volatility following Federal Reserve rate cuts.

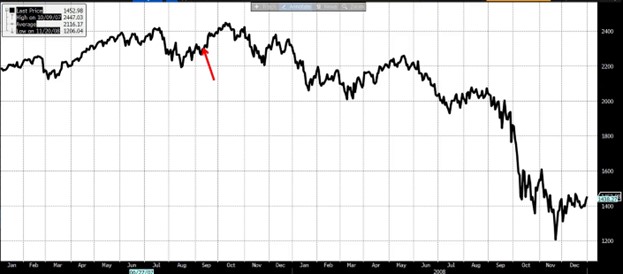
Source: Bloomberg
Historical Context and Current Trends
A recurring pattern emerges in financial markets: a steepening yield curve often coincides with increased volatility. This phenomenon is evident in both 2007 and 1998, as well as other periods of economic downturn.

Source: CME Group
- The Volatility Cycle: The yield curve’s movements often correlate with cyclical volatility patterns. A flat yield curve, typically associated with the end of an economic expansion and higher interest rates, often precedes a period of lower volatility. When the Federal Reserve cuts rates, steepening the yield curve, volatility tends to rise. This peak in volatility often coincides with the steepest point of the yield curve.
- The 2007 and 1998 Comparison: While both 2007 and 1998 featured a steepening yield curve and rising volatility, the underlying causes differed. In 1998, a volatility shock triggered by the Russian debt crisis prompted the Fed to lower rates. Conversely, in 2007, the Fed’s rate cuts were a response to a deteriorating labor market.
Volatility and the yield curve, often described as mean-reverting, exhibit a similar cyclical pattern of highs and lows.
The Current Landscape
The Federal Reserve’s decision to lower interest rates in 2024, amidst a backdrop of declining inflation and market volatility, raises questions about the similarities and differences to past crises. While the exact trajectory remains uncertain, the rising yield curve and increasing volatility suggest a potential parallel to the many times in history the Yield Curve got steeper.
The visualization below demonstrates the historical pattern: As the yield curve (in black) rises, volatility (in orange) follows suit.

Source: Bloomberg
Conclusion
As the financial landscape continues to evolve, understanding the historical context and current trends is essential for making informed investment decisions. By recognizing the cyclical nature of volatility and leveraging specialized strategies, investors can mitigate risks and protect their portfolios from market downturns.
My 50-Cents – Fed Analysis from Leland Abrams of Wynkoop, LLC
The Federal Reserve Board cut their benchmark rate this week by 50 bps to a new range of 4.75% – 5.00%. They indicated this is the start of a rate cutting process and further cuts were coming, likely another 50 bps by year end. The market had been pricing in an approximate 65% chance of this happening the day of the decision. We boldly prognosticated this larger than usual rate cut more than two months ago when the market was not even fully pricing in a chance of a 25 bps cut at the September FOMC meeting.
Anyone who has observed the material weakening in the labor market coupled with quickly dropping inflation (and deflation in economically sensitive areas) in addition to the very weak observations in the Fed’s Beige Book should not have been surprised by the size of this first rate cut. Fed Chairman Jay Powell brought up the Beige Book without being prompted when defending his rate cut during the press conference on Wednesday. The Beige Book, a qualitative summary of business and economic activity by region, did not paint a good picture. According to its findings, more than half of the Federal Reserve Districts are already in a recession (declining economic activity) and another quarter are experiencing stagnant growth. This report does not jive with the Bureau of Labor Statistics’ GDP reports. We believe the Beige Book offers a better, real-time, glimpse into what is happening on the ground with respect to the economy. This clearly spooked Jay Powell.
We have written ad nauseum about inflation coming down and likely being lower than the reports indicate. For example, if the U.S. used the European calculation for inflation, we would see a YoY number in the high 1%s, below the Fed target of 2%. Economically sensitive areas are experiencing outright and accelerating deflation. While GDP measures aggregate demand of the economy, one must look at the supply side to see where prices are going. Aggregate supply has outstripped aggregate demand, which puts DOWNWARD pressure on prices. Also, the commodity complex has been performing terribly despite a weaker dollar (weak dollar usually makes commodities rally). We see little to no reason to be concerned about inflation reigniting.
The bond market was mostly ahead of the Fed’s cut and now the two are relatively in sync with each other (bond futures pricing and Fed dot plot). We noted previously that the longer end of the curve could become stuck and we favored the front end of the curve, which still has significant room to drop. The initial reaction to the Fed 50 bp cut was actually to see bonds selling off (an example of buy the rumor, sell the fact). If we study the analogs of 2000/2001 and particularly 2007 (the 2-year note behavior is almost identical), we see some correction selling off (yields moving slightly higher) in the short term, only to resume a significant bull-steepening rally of the rate curve in the coming months.
We are not in the soft-landing camp. We think the Fed was and still is behind the curve and believe it is unlikely they can arrest the deterioration in the jobs market and hence economic activity. If history rhymes, the recession we’ve all been waiting for (and many who have given up on) may have just begun.