
Higher Yields: Not Necessarily Good News for Traditional Fixed Income Investors
September 2026
Navigating Higher Rates Through Corporate Credit.
Higher Yields: Not Necessarily Good News for Traditional Fixed Income Investors
By Larry Holzenthaler
Senior Portfolio Manager, Fixed Income, Catalyst Funds
Since the Global Financial Crisis, fixed-income investors have generally been fixated on the Fed and, more specifically, the Fed Funds Rate. Following many years of “zero rates,” a rapidly rising Fed Funds Rate wreaked havoc on a number of asset classes in early 2022. For anyone under the age of 50, the term “higher rates” has effectively been synonymous with the Fed Funds Rate for their entire career.
This year, however, has been different. Recently, the market has become increasingly focused on long-term rates. At the same time, the Fed has raised the Fed Funds Rate target by 25 basis points and has suggested another hike later this year. Unfortunately for fixed income investors, moves further out on the yield curve have caused persistent underperformance across fixed income assets well before the market began pricing in renewed rate hikes by the Fed. Now, the market could potentially see both higher short- and long-term rates: not a great recipe for success for traditional fixed income. The good news is that short duration fixed income, including parts of the corporate credit market, are again proving to be a useful part of a potential solution for asset allocators looking to escape a yield curve that is shifting higher.
2022: The 0% Rate Party Finally Ends
Between 2009 and 2022, investors only had to live with a Fed Funds Rate above 1% for just over 3 years, with that rate peaking at 2.8% in December 2018. While a sudden spike in the Fed Funds Rate in 2022 caused significant volatility across fixed income assets, it was often lauded as a longer-term positive for investors, as “fixed income investors finally have income.” That may be true for future investments, but the results for existing portfolios have generally been devastating. For many traditional fixed income portfolios, total return nearly 6 years later remains flat to negative – even after including 6 full years of coupons.
How Bonds and Leveraged Loans Have Performed Since Rate Hikes Began in 2022
Cumulative Total Returns (%)
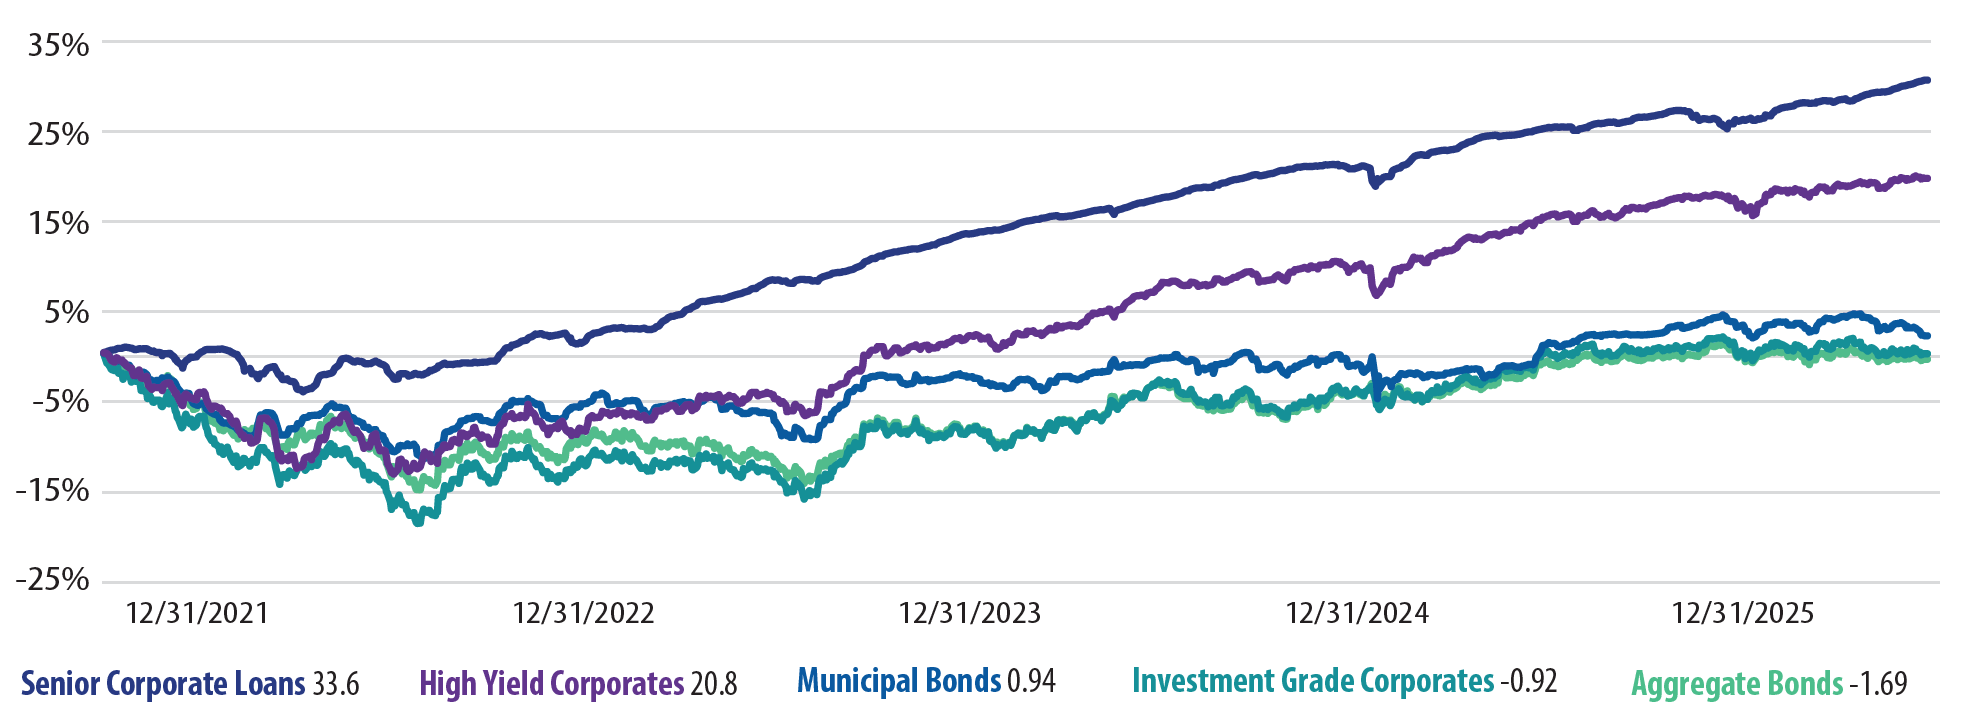
Source: Bloomberg Professional. Data from 12/31/2021 to 09/16/2026. Y-axis represents total return. Past performance does not guarantee future results. Please refer to important disclosures at the end of this presentation.
Not all fixed income investors have had an unpleasant experience amid the higher rate environment, however. As the chart above shows, one beneficiary has been senior corporate loans, which have floating rate coupon structures that reset every three months based on the Secured Overnight Fund Rate (SOFR). SOFR roughly tracks the Fed Funds Rate. Even high yield corporates, which are generally fixed rate and do have some sensitivity to rising interest rates, have produced relatively attractive total returns since the Fed began to raise rates.
How Have “Lower Rates” Impacted Fixed Income?
Following this brutally swift ratcheting higher in the Fed Funds Rate, investors finally got some relief in September 2024 when the Fed began to deliver a series of what totaled roughly 175 bps of rate cuts over the course of just over a year. It is worth taking a look at the same total return analysis as presented above, but instead looking at performance since the Fed Funds Rate started to go down. Unfortunately, and perhaps surprisingly, the results generally aren’t great. In fact, if you had bought the Bloomberg Aggregate Bond Index the day the Fed began to lower rates (i.e., September 16, 2024), today – almost exactly two years later – you’re still sitting with a meaningful principal loss, and a total return of less than 3% in roughly 2 years (which represents an annualized return of 1.48% in an index that bears no fees or expenses).
Returns Since Fed Cuts Began in 2024 – High Yield Corporates and Senior Corporate Loans Stand Out
Cumulative Total Return (%)
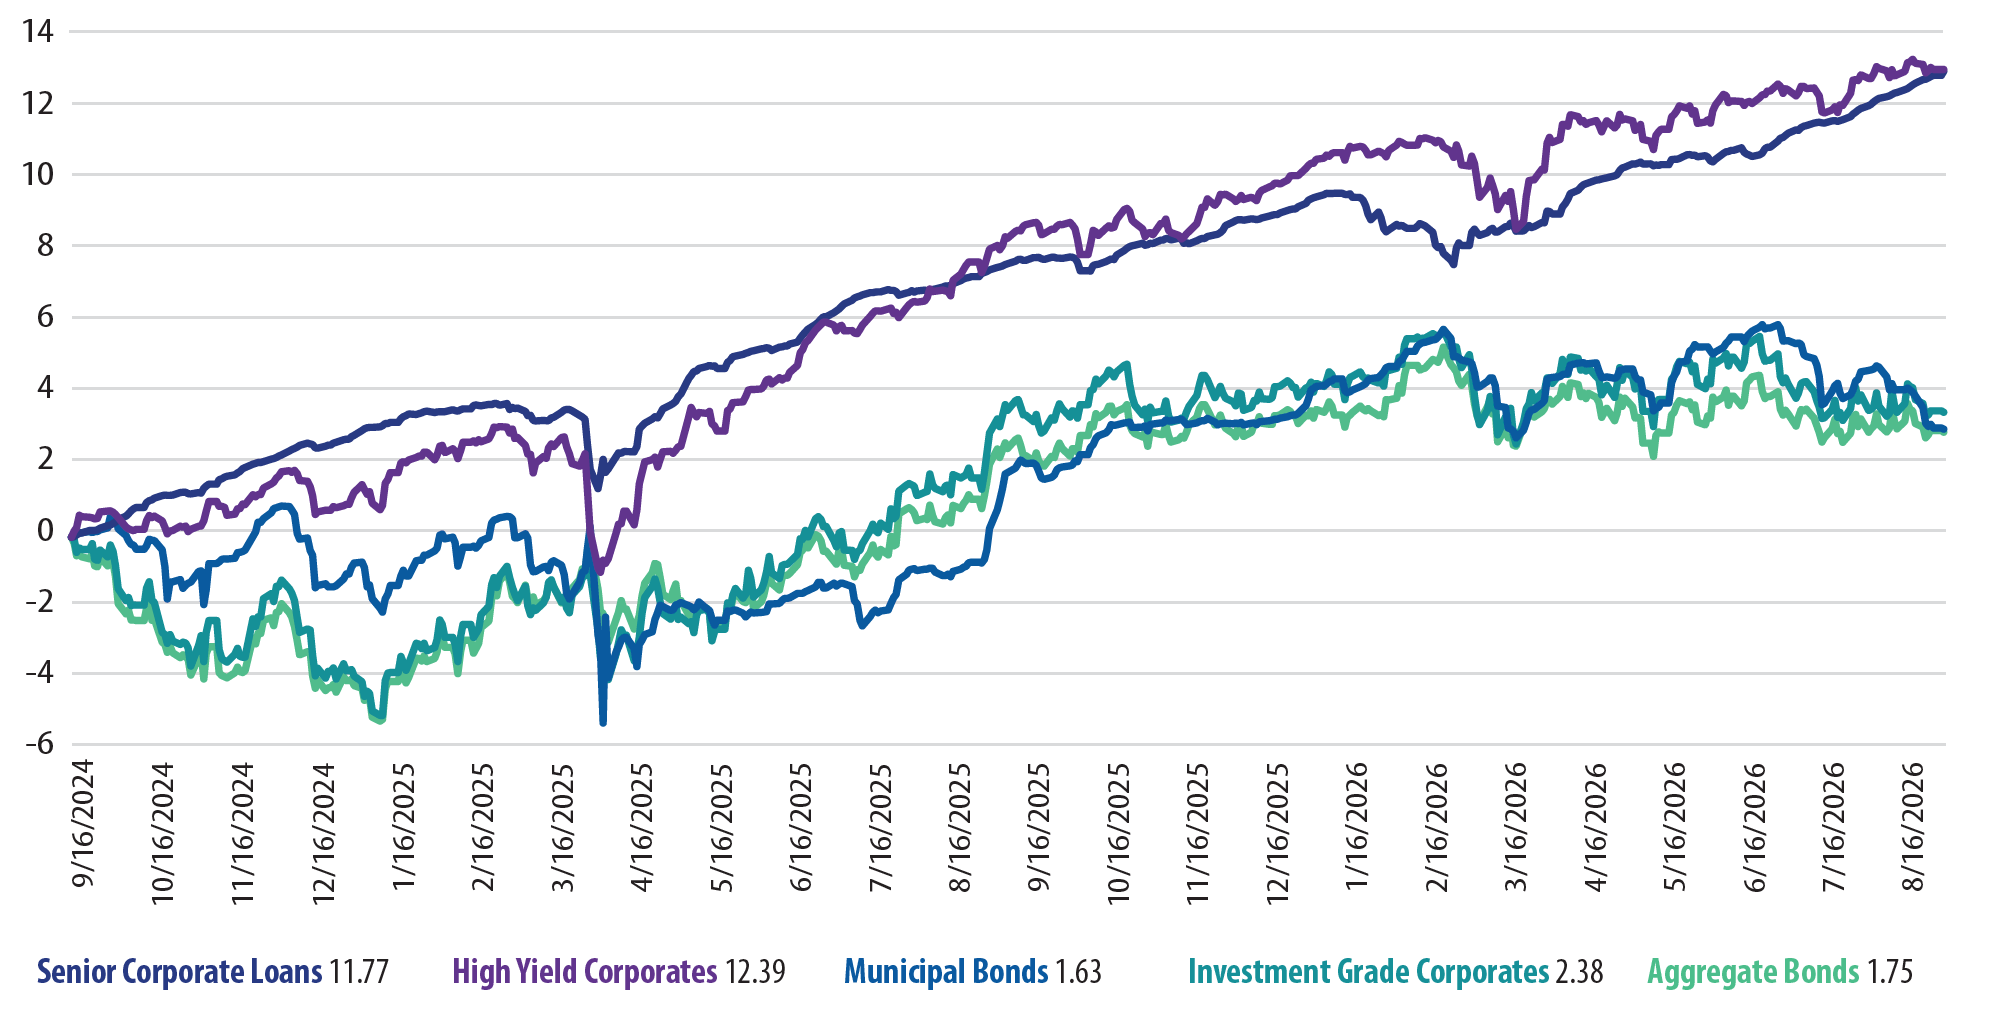
Source: Bloomberg Professional. Data from 12/31/2021 to 09/16/2026. Y-axis represents total return. Past performance does not guarantee future results. Please refer to important disclosures at the end of this presentation.
So, what in fixed income did work amid falling short term rates? It’s a similar story: credit related assets, such as high yield corporates and senior corporate loans have generally provided relatively steady positive total return.
This Year: Renewed Focus on Long Rates
Recently, fixed income investors have been reminded of the potential impact of higher long-term rates on their portfolios. Inflation, shifting Fed expectations, government deficits around the globe, geopolitical risk and higher energy costs, AI spend that is both extremely price insensitive and competing for bond investment dollars, and a relatively strong economy in the US have all contributed to a meaningful rise in long-term rates. This began to accelerate in February with the beginning of the conflict in Iran and increased further in late June.
10 Year US Treasury Yield
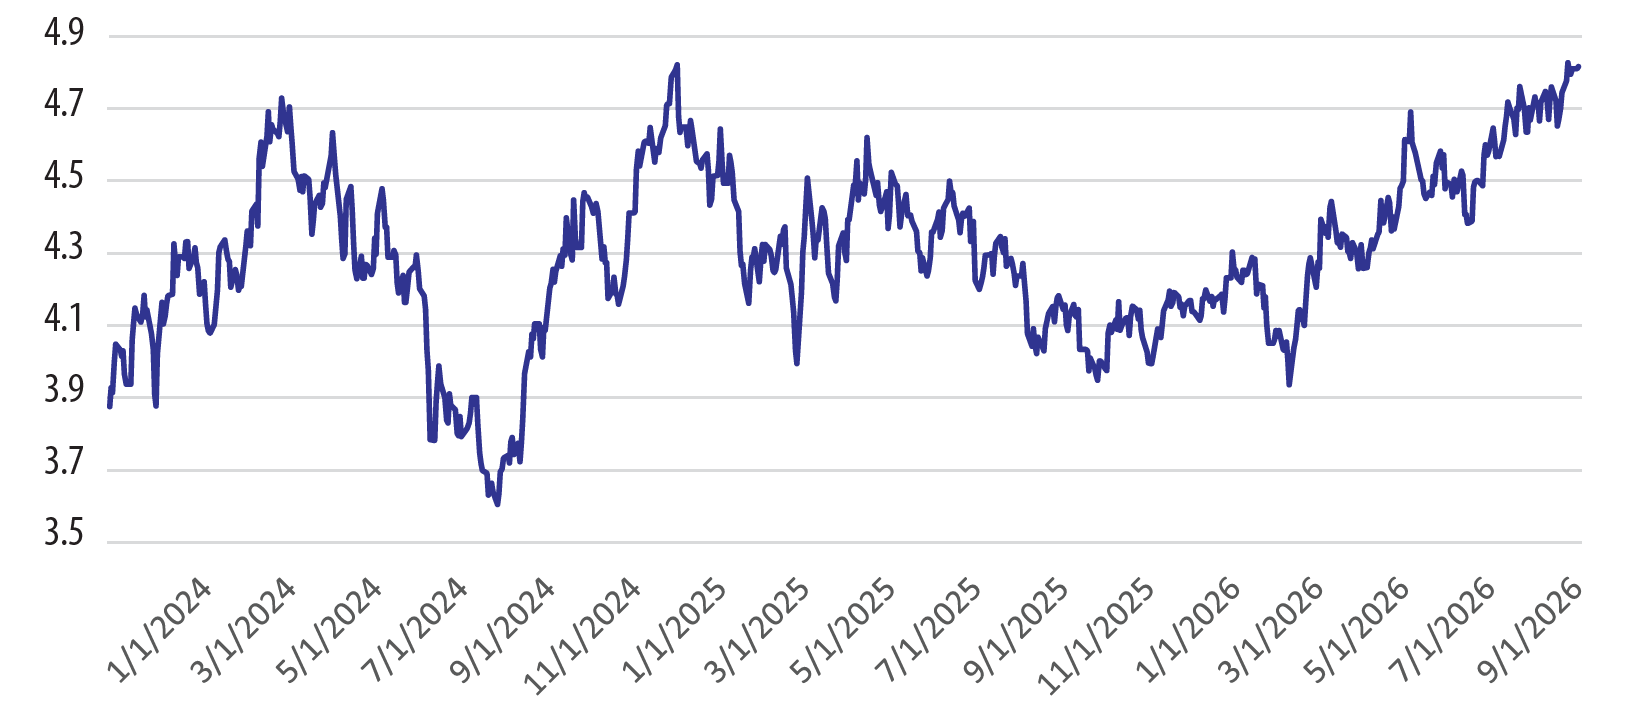
Source: Bloomberg Professional. Data from 01/01/2024 to 09/16/2026. Y-axis represents the yield of a 10-Year US Treasury. Past performance does not guarantee future results. Please refer to important disclosures at the end of this presentation.
For fixed income investors, the result has been all too familiar: more downside volatility.
Total Returns
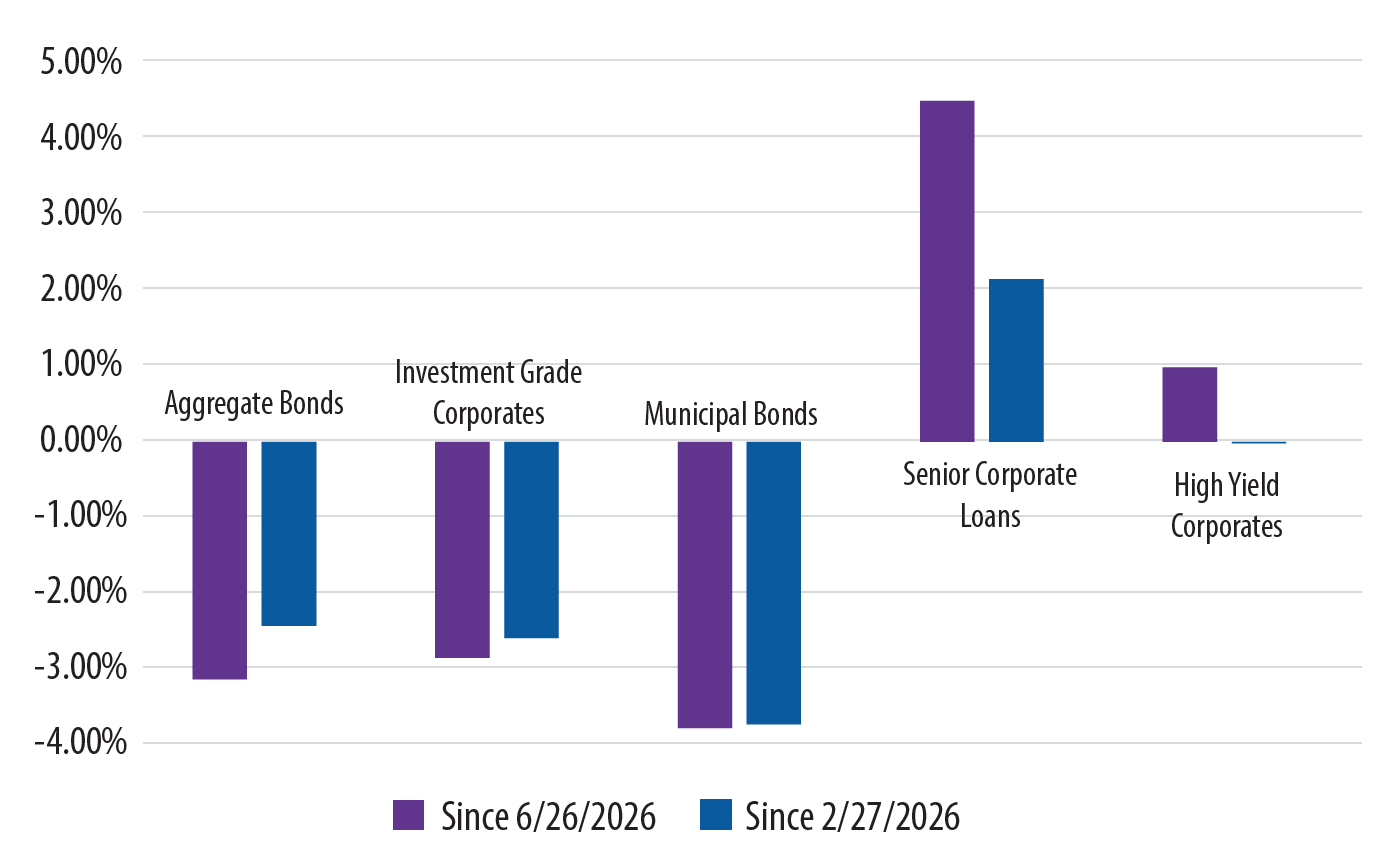
Source: Bloomberg Professional. Data from 2/27/2026 and 6/26/2026, respectively, through 9/16/2026. Y-axis represents total return. Past performance does not guarantee future results. Please refer to important disclosures at the end of this presentation.
Again, amid the recent volatility in long-term rates, assets like senior corporate loans and high yield bonds have generally produced positive total returns for investors.
Investing in Higher Yielding Corporate Credit: May Not be as Risky as it Sounds
Investors are often surprised to hear that certain high yield corporate bonds may actually be less volatile than investment grade corporate bonds. While high yield bonds do come with more credit risk, they also typically come with a lower duration profile. Duration is a measure of the sensitivity of the price of an asset (e.g., a bond) to changes in interest rates. In a stable or growing economy, however, taking on less duration risk and a bit more credit risk might make sense for certain investors.
High Yield Corporate Bonds: Potential for Lower Volatility vs. Investment Grade Bonds
Volatility (annualized %)
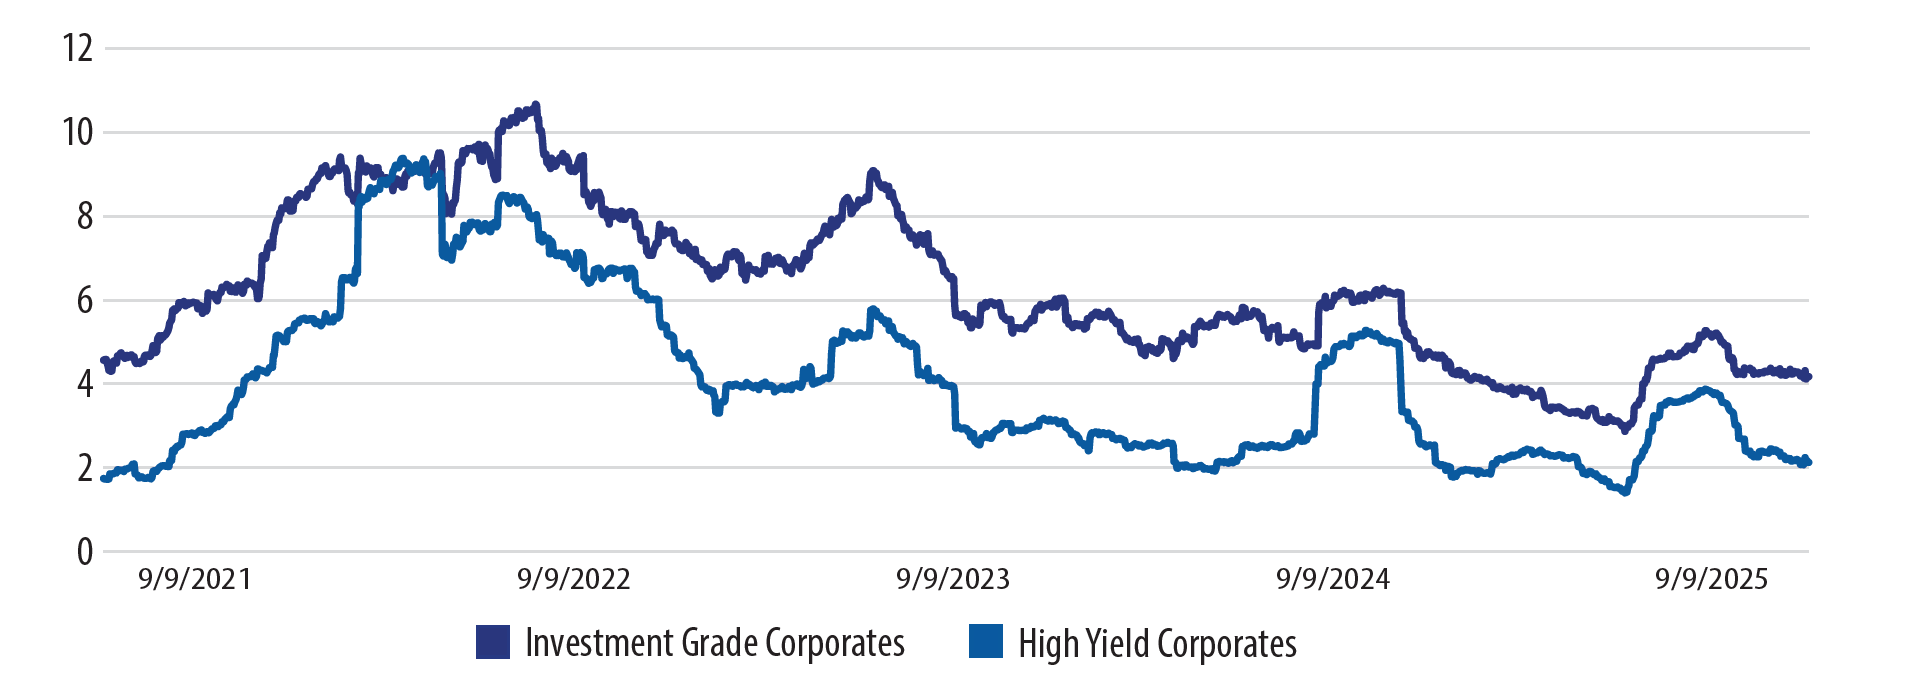
Source: Bloomberg Professional. Data from 09/09/2021 to 09/16/2026. Y-axis represents annualized volatility. Past performance does not guarantee future results. Please refer to important disclosures at the end of this presentation.
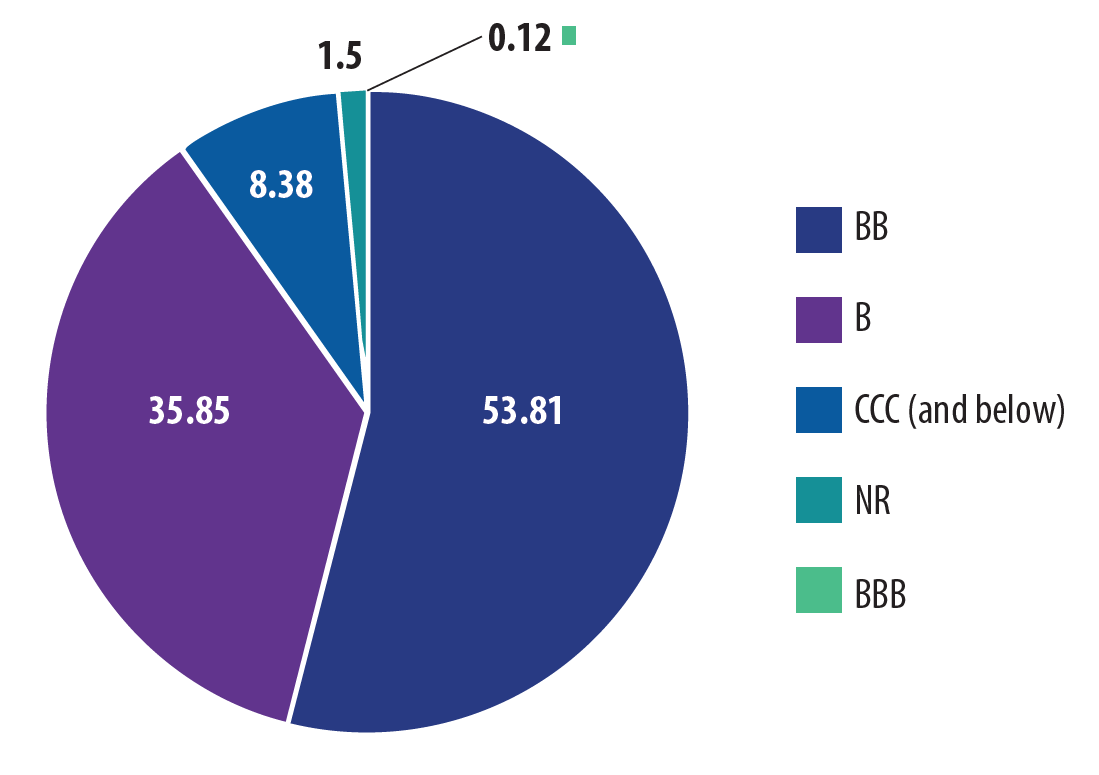
Investing in Today’s Credit MarketA common observation in today’s credit market is that spreads are very tight, which is generally true across nearly every corner of fixed income. However, in the case of high yield bonds in particular, a strong argument could be made that there are sound fundamental factors driving that. Specifically, the average quality of the high yield market today is arguably the highest it’s ever been, with a record 53% of the high yield bond market rated BB as of 9/16/2026. Active, bottom-up credit analysis, however, clearly remains key despite the uptick in quality. |
More Than 53% of Current High Yield Market is Rated BB (a Record High)Credit Quality of High Yield Index
Source: Bloomberg Professional. Data as of 9/16/2026. Past performance does not guarantee future results. Please refer to important disclosures at the end of this presentation. |
Further, on an all-in yield basis, the high yield asset class is still benefiting from higher base rates. In fact, looking over the past 10 years, yields have only been higher than today in markets that could be considered “dislocated” (e.g. COVID; 2022).
High Yield (Yield to Worst, %)
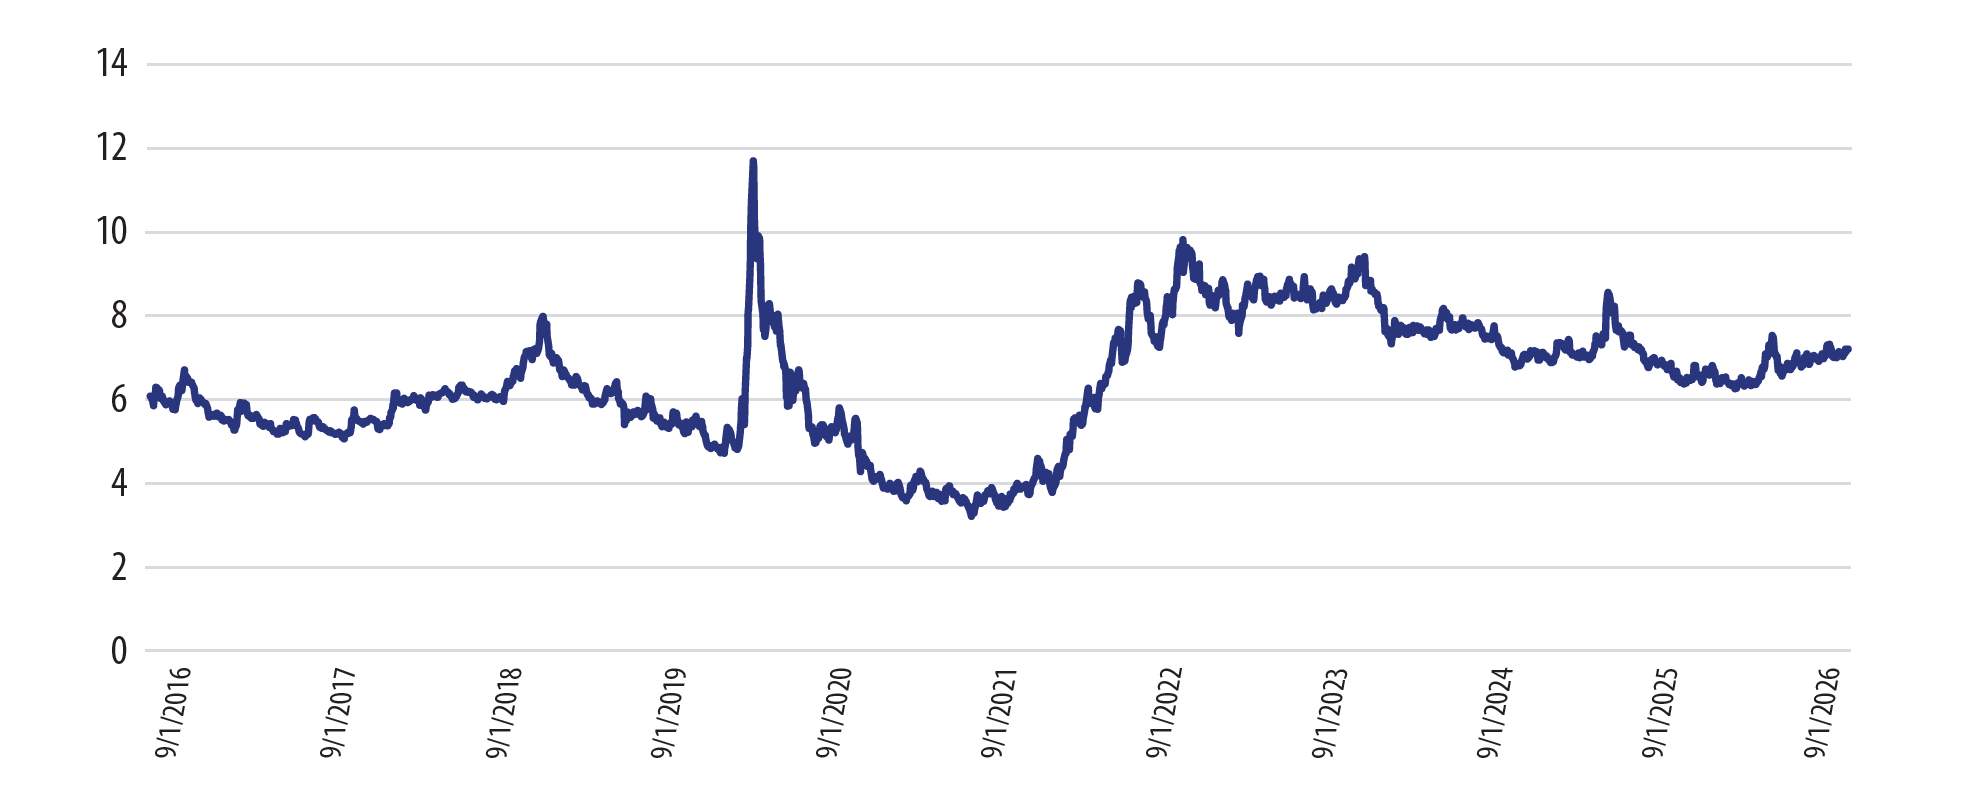
Source: Bloomberg Professional. Data from 09/01/2016 to 09/16/2026. Y-axis represents yield to worst % for high yield as an asset class. Past performance does not guarantee future results. Please refer to important disclosures at the end of this presentation.
Conclusion: The Case for Corporate Credit
We believe that compelling all-in yields and low duration, coupled with active management, has the potential to produce a relatively attractive risk and return experience for investors seeking income in the corporate credit market. While corporate credit may be less familiar and feel “riskier” to investors, the reality is that corporate credit may actually provide higher yields, less day-to-day volatility, and less uncertainty versus longer-duration fixed income. At the very least, investors should work with their financial advisors to better understand these asset classes and how they may be part of a potential investment solution in a world with higher rates.
DISCLOSURES
The information provided in this article is for general informational purposes only and reflects general investment characteristics as of the time of this writing; it is not intended to provide personalized investment, tax, or financial advice. References to specific funds, securities, strategies, yields, distributions, performance, ratings, or characteristics are provided for educational purposes and should not be interpreted as a recommendation, solicitation, or endorsement of any investment strategy or product. You cannot invest directly in an index and unmanaged index returns do not reflect any fees, expenses or sales charges.
Investing involves risk, including the possible loss of principal. Income-focused strategies may involve tradeoffs, including reduced growth potential, market risk, interest-rate risk, credit risk, leverage risk, liquidity risk, and tax considerations. Distribution rates, fund yields, expense ratios, and investment strategies may change and should not be viewed as current, nor are any figures or returns guaranteed. Past performance, historical comparisons, and ratings are not indicative of future results.
Tax treatment varies based on individual circumstances and account type. Investors should consult their tax advisor regarding the tax implications of investment decisions. Before investing, individuals should carefully review an investment’s offering documents, objectives, risks, charges, expenses, and other important information, consider whether the investment aligns with their financial circumstances and goals, and consider speaking with a financial adviser about their specific situation.
The author, publisher, or affiliated parties thereof may have relationships with certain investment products or issuers referenced in this article, including potential ownership interests, business relationships, or compensation arrangements. Any such relationships will be disclosed where applicable. Readers should consider this information when evaluating the discussion.
The views expressed herein are as of 9/16/2026. The information and opinions contained in this document have been compiled or arrived at based on sources believed to be reliable and in good faith; however, no representations or warranties of any kind are intended or should be inferred with respect to the accuracy of the information contained herein or the economic return of any investment, and no assurance can be given that existing laws will not be changed or interpreted adversely. All such information and opinions are subject to change without notice.
Some of the statements in this presentation may contain or be based on forward looking statements, estimates, projections, targets or prognoses (collectively, “forward looking statements”), which reflect the author’s current view of future events, economic developments and financial performance. Such forward looking statements are typically indicated by the use of words which express an estimate, expectation, belief, target or forecast. Such forward looking statements are based on an assessment of historical economic data, on the experience and current plans of the author and on the indicated sources. These forward looking statements contain no representation or warranty of whatever kind that such future events will occur or that they will occur as described herein, or that such results will be achieved by any investment, as the occurrence of these events and the results of any investment are subject to various risks and uncertainties. The actual results of an investment may differ substantially from those assumed in the forward looking statements. The opinions expressed reflect the best judgment of the author at the time this letter was drafted, and the author will not undertake to update or review the forward looking statements contained in this presentation, whether as a result of new information or any future event or otherwise.
Bloomberg Index Services Limited. BLOOMBERG® and the indices referenced herein (the “Indices”, and each such index, an “Index”) are service marks of Bloomberg Finance L.P. and its affiliates (collectively, “Bloomberg”) and/or one or more third-party providers (each such provider, a “Third-Party Provider,”) and have been licensed for use for certain purposes to RATIONAL ADVISORS, INC (the “Licensee”). To the extent a Third-Party Provider contributes intellectual property in connection with the Index, such third-party products, company names and logos are trademarks or service marks, and remain the property, of such Third-Party Provider. Bloomberg or Bloomberg’s licensors own all proprietary rights in the Bloomberg Indices. Neither Bloomberg nor Bloomberg’s licensors, including a Third-Party Provider, approves or endorses this material, or guarantees the accuracy or completeness of any information herein, or makes any warranty, express or implied, as to the results to be obtained therefrom and, to the maximum extent allowed by law, neither Bloomberg nor Bloomberg’s licensors, including a Third-Party Provider, shall have any liability or responsibility for injury or damages arising in connection therewith.
GLOSSARY
Aggregate Bonds are measured by the Bloomberg US Aggregate Index. The Bloomberg US Aggregate Index is a broad-based flagship benchmark that measures the investment grade, US dollar-denominated, fixed-rate taxable bond market. The index includes Treasuries, government-related and corporate securities, MBS (agency fixed-rate pass-throughs), ABS and CMBS (agency and non-agency).
Investment Grade Corporates are measured by The Bloomberg US Corporate Bond Index. The Bloomberg US Corporate Index measures the investment grade, fixed-rate, taxable corporate bond market. It includes USD denominated securities publicly issued by US and non-US industrial, utility, and financial issuers.
Senior Corporate Loans are measured by the S&P UBS Leveraged Loan Index. The S&P UBS Leveraged Loan Index measures the performance of U.S. dollar-denominated leveraged loans, which are loans extended to highly indebted, sub-investment-grade companies, often used for leveraged buyouts, acquisitions, or dividend recapitalizations.
High Yield Corporates are measured by the Bloomberg US Corporate High Yield Bond Index. The Bloomberg US Corporate High Yield Bond Index measures the performance of the USD-denominated, high yield, fixed-rate corporate bond market in the United States.
