[vc_row][vc_column css=”.vc_custom_1532034303005{background-color: #ffffff !important;}”][vc_row_inner][vc_column_inner][mk_padding_divider size=”150″][mk_fancy_title size=”40″ force_font_size=”true” size_smallscreen=”40″ size_tablet=”30″ size_phone=”30″ font_weight=”bold” txt_transform=”capitalize” margin_bottom=”0″ font_family=”none”]
How to Position Your Portfolio for A Lost Decade for Stocks and Bonds
[/mk_fancy_title][vc_column_text css=”.vc_custom_1734009183306{margin-bottom: 0px !important;}”]A fund like MBXIX has the potential to add value to a portfolio during a lost decade.[/vc_column_text][vc_column_text css=”.vc_custom_1734009316859{margin-bottom: 0px !important;}”]October 2024[/vc_column_text][mk_divider style=”thin_solid” margin_top=”0″][vc_column_text css=”.vc_custom_1734009333979{margin-bottom: 0px !important;}”]A lost decade | a decade where an asset class generates negative returns – can derail an investor’s
long-term financial goals. Near-zero yields that are bound to increase combined with stretched equity valuations and growing risks have had investors with heavy exposure to “traditional” portfolio models on alert for years. While investors may have seen the S&P’s bounceback in 2023 as a sign that we’re out of the woods, it’s important to note that this recovery also happened in the 2000’s (as illustrated below) during the prior lost decade and we believe that investors should remain vigilant given the fragile market environment in which we remain.
Additionally, an October 2024 article from Investment News notes that Goldman Sachs strategists are “warning of lackluster returns over the next decade.” The strategists noted that “investors should be prepared for equity returns during the next decade that are toward the lower end of their typical
performance distribution.” In short, we believe investors shouldn’t view any recent rallies as a sign that a lost decade should be dismissed.
Trying to manage upside participation and downside market risk makes a fund like the Catalyst/Millburn Hedge Strategy Fund (MBXIX) a potentially compelling option for a portfolio. Whether looking to complement traditional investments or replacing pure equity, MBXIX combines an allocation to long-only equity ETFs with a long/short futures portfolio that spans 125+ global markets. This strategy has the potential to provide positive returns in both bear and bull markets, and MBXIX has done so historically since inception in 1997.[/vc_column_text][/vc_column_inner][/vc_row_inner][vc_row_inner][vc_column_inner css=”.vc_custom_1553117738807{background-color: #ffffff !important;}”][mk_fancy_title color=”#000000″ size=”18″ font_weight=”bold” txt_transform=”capitalize” margin_bottom=”0″ font_family=”none” align=”center”]MBXIX Generated a +164% Return During the Last Lost Decade for the S&P 500 Index.[/mk_fancy_title][vc_column_text css=”.vc_custom_1734012817177{margin-bottom: 0px !important;}”][/vc_column_text][vc_column_text css=”.vc_custom_1734009379474{margin-bottom: 0px !important;}”]Source: Catalyst Capital Advisors LLC and Bloomberg LP.
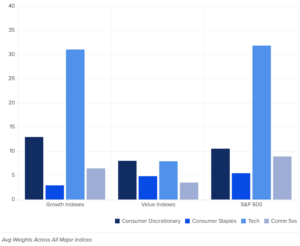
Past performance does not guarantee future results and there is no assurance that the Fund will achieve its investment objective.
[/vc_column_text][vc_column_text css=”.vc_custom_1734009398683{margin-bottom: 0px !important;}”]Despite the drawdown in equities that has already occurred, the S&P 500 TR’s cyclically adjusted price-to-earnings ratio as of September 2024 is still at 38.7x (compared to the long-term average of 20.9x). This suggests that equities could still see an ongoing decline. Likewise, bond yields still remain near historical lows.[/vc_column_text][vc_column_text css=”.vc_custom_1695670169602{margin-bottom: 0px !important;}”][/vc_column_text][/vc_column_inner][/vc_row_inner][vc_row_inner][vc_column_inner css=”.vc_custom_1553117738807{background-color: #ffffff !important;}”][mk_fancy_title color=”#000000″ size=”18″ font_weight=”bold” txt_transform=”capitalize” margin_bottom=”0″ font_family=”none” align=”center”]The S&P 500 Index has not Historically Delivered Strong Returns Following Valuations like September 2024.[/mk_fancy_title][vc_single_image image=”4064″ img_size=”full”][vc_column_text css=”.vc_custom_1734009470756{margin-bottom: 0px !important;}”]Source: Robert Shiller and Catalyst Capital Advisors LLC based on data from 1900 to September 2024.[/vc_column_text][vc_column_text css=”.vc_custom_1695670169602{margin-bottom: 0px !important;}”][/vc_column_text][/vc_column_inner][/vc_row_inner][vc_row_inner][vc_column_inner css=”.vc_custom_1553117738807{background-color: #ffffff !important;}”][mk_fancy_title color=”#000000″ size=”18″ font_weight=”bold” txt_transform=”capitalize” margin_bottom=”0″ font_family=”none” align=”center”]How Does MBXIX Currently Implement its Strategy[/mk_fancy_title][vc_column_text css=”.vc_custom_1695670169602{margin-bottom: 0px !important;}”][/vc_column_text][/vc_column_inner][/vc_row_inner][vc_row_inner attached=”true” column_padding=”5″][vc_column_inner width=”1/2″ css=”.vc_custom_1734011233785{border-bottom-width: 10px !important;background-color: #e8e8e8 !important;border-bottom-color: #8059bd !important;border-bottom-style: solid !important;}”][vc_column_text css=”.vc_custom_1695670169602{margin-bottom: 0px !important;}”][/vc_column_text][mk_fancy_title color=”#000000″ size=”20″ font_weight=”bold” font_family=”none” align=”center”]Passive Equity Portfolio
Approximately $0.50 of notional exposure for every $1.00 invested[/mk_fancy_title][vc_column_text css=”.vc_custom_1734009959451{margin-bottom: 0px !important;}”]
- Designed to provide beta exposure to equities for normal, upward trending markets
- Domestic, developed, and emerging market exposure via ETFs
- U.S. equity exposure diversified by market capitalization (small, mid, and large)
[/vc_column_text][/vc_column_inner][vc_column_inner width=”1/2″ css=”.vc_custom_1734011240266{border-bottom-width: 10px !important;background-color: #e8e8e8 !important;border-bottom-color: #8059bd !important;border-bottom-style: solid !important;}”][mk_fancy_title size=”20″ font_weight=”bold” font_family=”none” align=”center”]Futures Program
Approximately $0.70 of notional exposure for every $1.00 invested[/mk_fancy_title][vc_column_text css=”.vc_custom_1734009980754{margin-bottom: 0px !important;}”]
- Designed to leverage uncorrelated nature for both incremental returns and to offset equities during periods of long-term structural market change
- Multiple model approach
- Implements machine learning technology
[/vc_column_text][/vc_column_inner][/vc_row_inner][vc_row_inner][vc_column_inner css=”.vc_custom_1553117738807{background-color: #ffffff !important;}”][vc_column_text css=”.vc_custom_1734009571515{margin-bottom: 0px !important;}”]The approach cannot be replicated through two different funds as $1.00 allocated separately to futures and equities will only give an investor $1.00 in exposure. With the investment approach of MBXIX, more than 100% notional exposure is possible because collateral required for futures is less than the notional exposure provided (i.e., $0.30 in collateral may be needed for $0.70 in exposure).[/vc_column_text][vc_column_text css=”.vc_custom_1695670169602{margin-bottom: 0px !important;}”][/vc_column_text][/vc_column_inner][/vc_row_inner][vc_row_inner][vc_column_inner css=”.vc_custom_1553117738807{background-color: #ffffff !important;}”][vc_single_image image=”4059″ img_size=”full”][vc_column_text css=”.vc_custom_1734010341626{margin-bottom: 0px !important;}”]Managed Futures involve risks different from, or possibly greater than, the risks associated with investing directly in securities and other traditional investments. there is no guarantee that any investment strategy will achieve its objectives, generate profits or avoid losses. Past performance does not guarantee future results and there is no assurance that the Fund will achieve its investment objective.[/vc_column_text][vc_column_text css=”.vc_custom_1734010362970{margin-bottom: 0px !important;}”]The result for MBXIX over multiple market cycles has been a fund that has outperformed major equity markets during five-year rolling periods without a single negative period from inception to September 30, 2024.
[/vc_column_text][vc_single_image image=”4061″ img_size=”full”][vc_column_text css=”.vc_custom_1734010501466{margin-bottom: 0px !important;}”]Going forward, it’s difficult to predict where markets will end up in 2024. In managing money for clients, we understand the goal is to help investors meet their long-term financial objectives, and this implies not only trying to avoid outsized drawdowns but also generating positive returns. It is for this reason we believe it is an ideal time to replace a meaningful portion of any equity allocation you may have with a strategy like MBXIX, which maintains the upside equity exposure but also provides a diversified and non-correlated futures component that could lead to positive returns in various market environments, including the environment we are in for in 2024 and beyond.
[/vc_column_text][/vc_column_inner][/vc_row_inner][vc_row_inner][vc_column_inner][mk_divider style=”thin_solid”][vc_column_text css=”.vc_custom_1732572074821{margin-bottom: 0px !important;}”]The Fund’s maximum sales charge for Class “A” shares is 5.75%. Investments in mutual funds involve risks. Performance is historic and does not guarantee future results. Investment return and principal value will fluctuate with changing market conditions so that when redeemed, shares may be worth more or less than their original cost. Current performance may be lower or higher than the performance data quoted. To obtain the most recent month end performance information or the funds prospectus please call the fund, toll free at 1-866-447-4228. You can also obtain a prospectus at www.CatalystMF.com.The Fund’s gross expense ratios are 2.28%, 3.03%, and 2.03% for Class A, C, and I, respectively.
There is no assurance that the Fund will achieve its investment objective. You cannot invest directly in an index and unmanaged index returns do not reflect any fees, expenses or sales charges. Performance shown before December 28, 2015 is for the Fund’s Predecessor Fund (Millburn Hedge Fund, L.P.).[/vc_column_text][vc_column_text css=”.vc_custom_1732572302206{margin-bottom: 0px !important;}”]Past performance is not a guarantee of future results.
Investors should carefully consider the investment objectives, risks, charges and expenses of the Catalyst Funds. This and other important information about the Fund can be obtained by calling 866-447-4228. The Catalyst Funds are distributed by Northern Lights Distributors, LLC, member FINRA/SIPC. Catalyst Capital Advisors, LLC is not affiliated with Northern Lights Distributors, LLC.
Risk Considerations:
Investing in the Fund carries certain risks. The Fund will invest a percentage of its assets in derivatives, such as futures and options contracts. The use
of such derivatives and the resulting high portfolio turnover may expose the Fund to additional risks that it would not be subject to if it invested directly
in the securities and commodities underlying those derivatives. The Fund may experience losses that exceed those experienced by funds that do not use futures contracts, options and hedging strategies. Investing in commodities markets may subject the Fund to greater volatility than investments in traditional securities. Currency trading risks include market risk, credit risk and country risk. Foreign investing involves risks not typically associated with U.S. investments. Changes in interest rates and the liquidity of certain investments could affect the Fund’s overall performance. The Fund is non-diversified and as a result, changes in the value of a single security may have significant effect on the Fund’s value. Other risks include U.S. Government securities risks and investments in fixed income securities. Typically, a rise in interest rates causes a decline in the value of fixed income securities or derivatives owned by the Fund. Furthermore, the use of leveraging can magnify the potential for gain or loss and amplify the effects of market volatility on the Fund’s share price. The Fund is subject to regulatory change and tax risks; changes to current rules could increase costs associated with an investment in the Fund. These factors may affect the value of your investment.
Performance shown before December 28, 2015 is for the Fund’s Predecessor Fund (Millburn Hedge Fund, L.P.). The prior performance is net of management fees and other expenses including the effect of the performance fee. The Predecessor Fund had an investment objective and strategies that were, in all material respects, the same as those of the Fund, and was managed in a manner that, in all material respects, complied with the investment guidelines and restrictions of the Fund. From its inception through December 28, 2015, the Predecessor Fund was not subject to certain investment restrictions, diversification requirements and other restrictions of the 1940 Act or the Code, which if they had been applicable, might have adversely affected its performance. In addition, the Predecessor Fund was not subject to sales loads that would have adversely affected performance. Performance of the predecessor fund is not an indicator of future results.
Investors cannot directly invest in an index and unmanaged index returns do not reflect any fees, expenses or sales charges.
There is no guarantee that any investment strategy will achieve its objectives, generate profits, or avoid losses.[/vc_column_text][vc_column_text css=”.vc_custom_1732571915029{margin-bottom: 0px !important;}”]Data as of quarter end: 2021-03-31T00:00:00
Annualized if greater than a year[/vc_column_text][mk_table]
| Share Class |
1 Month |
3 Months |
6 Months |
YTD |
1 Year |
3 Years Annualized |
5 Years Annualized |
10 Years Annualized |
Since Inception Annualized |
| Class I |
0.73% |
7.43% |
18.30% |
7.43% |
40.19% |
7.48% |
8.16% |
7.28% |
10.69% |
| Class A |
0.70% |
7.36% |
18.16% |
7.36% |
39.83% |
7.20% |
7.89% |
N/A |
8.95% |
| Class C |
0.65% |
7.18% |
17.72% |
7.18% |
38.79% |
6.41% |
7.09% |
N/A |
8.13% |
| Class C-1 |
0.65% |
7.18% |
N/A |
7.18% |
N/A |
N/A |
N/A |
N/A |
22.67% |
| Class A w/Sales Load |
-5.10% |
1.19% |
11.36% |
1.19% |
31.81% |
5.11% |
6.62% |
N/A |
7.73% |
[/mk_table][mk_divider style=”thin_solid”][vc_column_text css=”.vc_custom_1734011355634{margin-bottom: 0px !important;}”]Definitions
Lost Decade: A decade where an asset class generates negative returns. With regards to this piece, the “Lost Decade” referenced is for stocks starting on 12/31/1999 and lasting until 12/31/2009.
Price-to-Earnings Ratio: one of the most widely used metrics for investors and analysts to determine stock valuation. It shows whether a company’s stock price is overvalued or undervalued and can reveal how a stock’s valuation compares with its industry group or a benchmark like the S&P 500 Index.
Cyclically Adjusted Price to Earnings (CAPE) Ratio: A valuation measure that uses real earnings per share (EPS) over a 10-year period to smooth out fluctuations in corporate profits that occur over different periods of a business cycle.
Notional Exposure: A term used by derivatives traders to refer to the total value of the underlying asset in a contract.
Standard deviation: a statistical measurement of the dispersion of a dataset relative to its mean.
S&P 500 Index: A market capitalization-weighted index that is used to represent the U.S. large-cap stock market.
The MSCI All Country World Index (ACWI): a stock index designed to provide a broad measure of global equity market performance.
Russell 2000 Index: a subset of the Russell 3000® Index which is designed to represent approximately 98% of he investable US equity market.
20241025-3969551[/vc_column_text][/vc_column_inner][/vc_row_inner][mk_padding_divider size=”20″][vc_raw_html]JTNDc2NyaXB0JTIwdHlwZSUzRCUyMnRleHQlMkZqYXZhc2NyaXB0JTIyJTIwc3JjJTNEJTIyaHR0cHMlM0ElMkYlMkZjb2RlLmpxdWVyeS5jb20lMkZqcXVlcnktMS45LjEubWluLmpzJTIyJTNFJTNDJTJGc2NyaXB0JTNFJTBBJTNDc2NyaXB0JTIwc3JjJTNEJTIyaHR0cHMlM0ElMkYlMkZjZG5qcy5jbG91ZGZsYXJlLmNvbSUyRmFqYXglMkZsaWJzJTJGbW9tZW50LmpzJTJGMi4xOC4xJTJGbW9tZW50Lm1pbi5qcyUyMiUzRSUzQyUyRnNjcmlwdCUzRSUwQSUwQSUzQ3NjcmlwdCUyMHR5cGUlM0QlMjJ0ZXh0JTJGamF2YXNjcmlwdCUyMiUzRSUwQSUyMCUyMCUyNCUyOGRvY3VtZW50JTI5LnJlYWR5JTI4ZnVuY3Rpb24lMjglMjklMjAlN0IlMEElMjAlMjAlMjAlMjQlMjglMjIuZGF0ZWZvcm1hdCUyMiUyOS5odG1sJTI4ZnVuY3Rpb24lMjhpbmRleCUyQyUyMHZhbHVlJTI5JTIwJTdCJTBBJTIwJTIwJTIwJTIwcmV0dXJuJTIwbW9tZW50JTI4dmFsdWUlMkMlMjAlMjJZWVlZLU1NLUREVEhIJTNBbW0lM0FzcyUyMiUyOS5mb3JtYXQlMjglMjJNTS1ERC1ZWVlZJTIyJTI5JTNCJTBBJTdEJTI5JTNCJTBBJTBBJTIwJTIwJTdEJTI5JTNCJTBBJTNDJTJGc2NyaXB0JTNF[/vc_raw_html][/vc_column][/vc_row]


 From the article: “Instead of buying or shorting stocks directly, Miller employs a trend-following strategy that rides positive or negative momentum in major indexes across the US, Europe, and Japan. That frees him from the pressures of stock selection while allowing him to win in any market environment.” Read the full article below and see the attached for important disclaimers.[/vc_column_text][mk_button dimension=”two” corner_style=”full_rounded” size=”large” icon=”mk-icon-angle-right” url=”https://go.pardot.com/l/497001/2024-05-01/2b2fjtw/497001/1714570599o6z7lQaH/Business_Insider_Reprint_April_24.pdf” target=”_blank” bg_color=”#86c9ff”]Read the Full Article Here[/mk_button][/vc_column_inner][/vc_row_inner][mk_padding_divider size=”20″][vc_raw_html]JTNDc2NyaXB0JTIwdHlwZSUzRCUyMnRleHQlMkZqYXZhc2NyaXB0JTIyJTNFJTBBX2xpbmtlZGluX3BhcnRuZXJfaWQlMjAlM0QlMjAlMjIxMjczNjY2JTIyJTNCJTBBd2luZG93Ll9saW5rZWRpbl9kYXRhX3BhcnRuZXJfaWRzJTIwJTNEJTIwd2luZG93Ll9saW5rZWRpbl9kYXRhX3BhcnRuZXJfaWRzJTIwJTdDJTdDJTIwJTVCJTVEJTNCJTBBd2luZG93Ll9saW5rZWRpbl9kYXRhX3BhcnRuZXJfaWRzLnB1c2glMjhfbGlua2VkaW5fcGFydG5lcl9pZCUyOSUzQiUwQSUzQyUyRnNjcmlwdCUzRSUzQ3NjcmlwdCUyMHR5cGUlM0QlMjJ0ZXh0JTJGamF2YXNjcmlwdCUyMiUzRSUwQSUyOGZ1bmN0aW9uJTI4bCUyOSUyMCU3QiUwQWlmJTIwJTI4JTIxbCUyOSU3QndpbmRvdy5saW50cmslMjAlM0QlMjBmdW5jdGlvbiUyOGElMkNiJTI5JTdCd2luZG93LmxpbnRyay5xLnB1c2glMjglNUJhJTJDYiU1RCUyOSU3RCUzQiUwQXdpbmRvdy5saW50cmsucSUzRCU1QiU1RCU3RCUwQXZhciUyMHMlMjAlM0QlMjBkb2N1bWVudC5nZXRFbGVtZW50c0J5VGFnTmFtZSUyOCUyMnNjcmlwdCUyMiUyOSU1QjAlNUQlM0IlMEF2YXIlMjBiJTIwJTNEJTIwZG9jdW1lbnQuY3JlYXRlRWxlbWVudCUyOCUyMnNjcmlwdCUyMiUyOSUzQiUwQWIudHlwZSUyMCUzRCUyMCUyMnRleHQlMkZqYXZhc2NyaXB0JTIyJTNCYi5hc3luYyUyMCUzRCUyMHRydWUlM0IlMEFiLnNyYyUyMCUzRCUyMCUyMmh0dHBzJTNBJTJGJTJGc25hcC5saWNkbi5jb20lMkZsaS5sbXMtYW5hbHl0aWNzJTJGaW5zaWdodC5taW4uanMlMjIlM0IlMEFzLnBhcmVudE5vZGUuaW5zZXJ0QmVmb3JlJTI4YiUyQyUyMHMlMjklM0IlN0QlMjklMjh3aW5kb3cubGludHJrJTI5JTNCJTBBJTNDJTJGc2NyaXB0JTNFJTBBJTNDbm9zY3JpcHQlM0UlMEElM0NpbWclMjBoZWlnaHQlM0QlMjIxJTIyJTIwd2lkdGglM0QlMjIxJTIyJTIwc3R5bGUlM0QlMjJkaXNwbGF5JTNBbm9uZSUzQiUyMiUyMGFsdCUzRCUyMiUyMiUyMHNyYyUzRCUyMmh0dHBzJTNBJTJGJTJGcHguYWRzLmxpbmtlZGluLmNvbSUyRmNvbGxlY3QlMkYlM0ZwaWQlM0QxMjczNjY2JTI2Zm10JTNEZ2lmJTIyJTIwJTJGJTNFJTBBJTNDJTJGbm9zY3JpcHQlM0U=[/vc_raw_html][/vc_column][/vc_row]