
An Introduction to Balanced Risk
February 2026
Building a Risk-Balanced Portfolio for Volatile Markets
An Introduction to Balanced Risk
Are You Doing Enough to Ward off Volatility for Turbulent Times?
You Might Be Missing Out if You’re Only Considering Stocks and Bonds
Diversification is often referred to as the only free lunch in investing. But while most financial professionals understand the potential benefits of diversification, some are still relying primarily on stocks and bonds to construct portfolios.
If investors are not also considering an allocation to alternatives, it is our belief that not only are they foregoing diversification, but they’re also missing out on an investment universe that has a demonstrated ability to perform independent of stocks and bonds when traditional investments struggle.
In our balanced risk series, we’ll remove the barriers to entry and help advisors explain the potential benefits of investing in liquid alternatives.
|
Liquid Alternatives Liquid alternatives are investment funds (like ETFs and mutual funds) that use complex, hedge fund-like strategies, such as long/short, derivatives, and leverage. However, these strategies are packaged for everyday investors, offering daily liquidity, transparency, and diversification from traditional stocks and bonds, aiming to provide returns in different market conditions. |
The Benefits of Liquid AlternativesLiquid alternatives can provide many potential benefits to a portfolio. Consider a balanced risk strategy (or hybrid strategy), which maintains exposure to traditional asset classes while adding on exposure to a non-correlated strategy like managed futures. A balanced risk strategy is often an ideal option for those looking to integrate alternatives that have the potential to perform well during periods of market turmoil, but does not sacrifice the exposure they already have to a traditional investment allocation. To show the potential power of balanced risk strategies (and their managed futures component), on the next page is an allocation which incorporates a balanced risk strategy into a more traditional stock and bond approach. As you’ll see, the addition of a balanced risk strategy to a traditional portfolio generally would have provided investors with higher returns and shallower drawdowns. We also want to highlight that by using a balanced risk strategy, investors are not losing their exposure to stocks and bonds by implementing alternatives. |

How Adding a Balanced Risk Strategy Can Enhance a Portfolio

| 60% Stocks 40% Bonds |
54% Stocks 36% Bonds 10% Balanced Risk |
48% Stocks 32% Bonds 20% Balanced Risk |
42% Stocks 28% Bonds 30% Balanced Risk |
36% Stocks 24% Bonds 40% Balanced Risk |
|
| Annualized Return | 6.75% | 7.27% | 7.78% | 8.26% | 8.73% |
| Volatility | 9.46% | 9.20% | 9.15% | 9.30% | 9.65% |
| Return/Risk | 0.71 | 0.79 | 0.85 | 0.89 | 0.90 |
| Worst Drawdown | 32.54% | 30.57% | 28.57% | 26.54% | 24.69% |
Data Source: Bloomberg LP and Catalyst Capital Advisors LLC. Based on monthly return data from 12/31/1999 to 12/31/2025. Stocks are represented by the S&P 500 TR Index; bonds are represented by the Bloomberg US Aggregate Bond Index; Balanced Risk Strategy is represented by 100% notional exposure to SG CTA Trend Index, 50% allocation to the S&P 500 and a 50% allocation to the Bloomberg US Short Treasury TR Index (to represent collateral for futures program). Rebalanced monthly. Past performance does not guarantee future results. See important disclosures at the end of this presentation, including with respect to the limitations inherent to hypothetical performance comparisons.
Growth of $100: Outperformance of Balanced Risk (Hybrid) Strategy’s Offense and Defense Approach
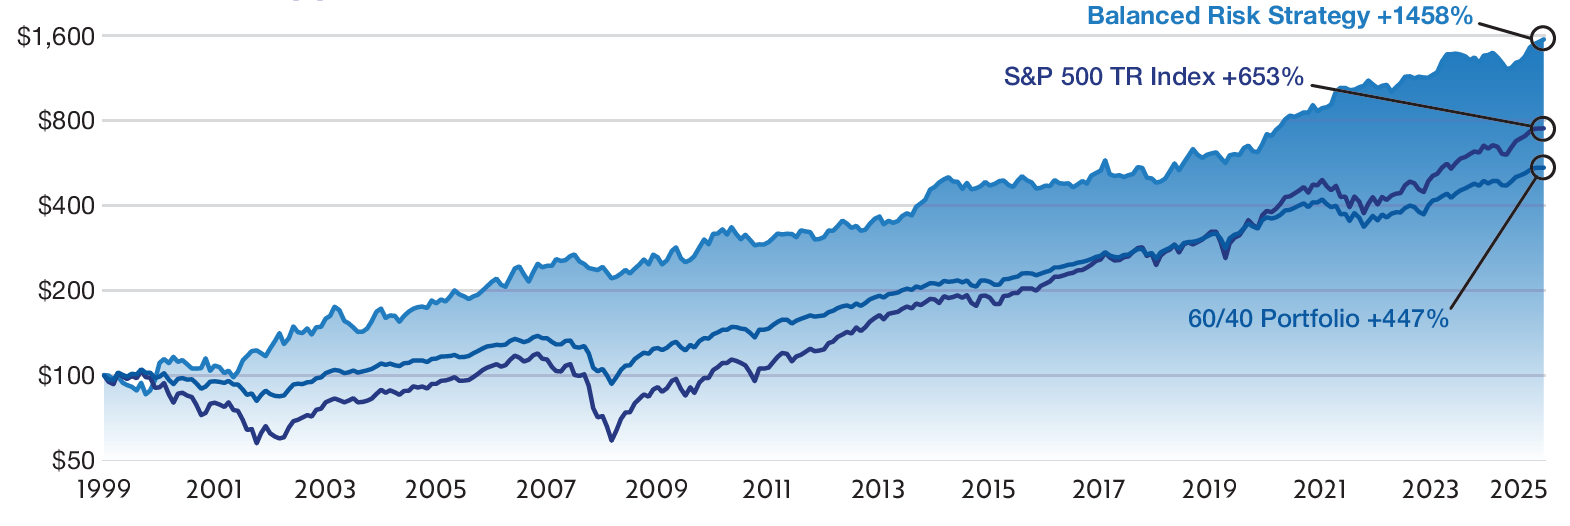
Data Source: Bloomberg LP and Catalyst Capital Advisors LLC. Based on monthly return data from 12/31/1999 to 12/31/2025. Graph presented in logarithmic scale. 60%/40% Portfolio represented by 60% allocation to the S&P 500 TR Index (“S&P 500”) and 40% allocation to the Bloomberg Agg TR Index (“Agg”) rebalanced monthly. Balanced Risk Strategy represented by 100% notional exposure to SG CTA Trend Index, 50% allocation to the S&P 500 and a 50% allocation to the Bloomberg US Short Treasury TR Index (to represent collateral for futures program), rebalanced monthly. Past performance does not guarantee future results. See important disclosures at the end of this presentation, including with respect to the limitations inherent to hypothetical performance comparisons.
A Balanced Risk Strategy has Historically Had Zero Negative Rolling 3-Year, 5-Year, and 10-Year Periods
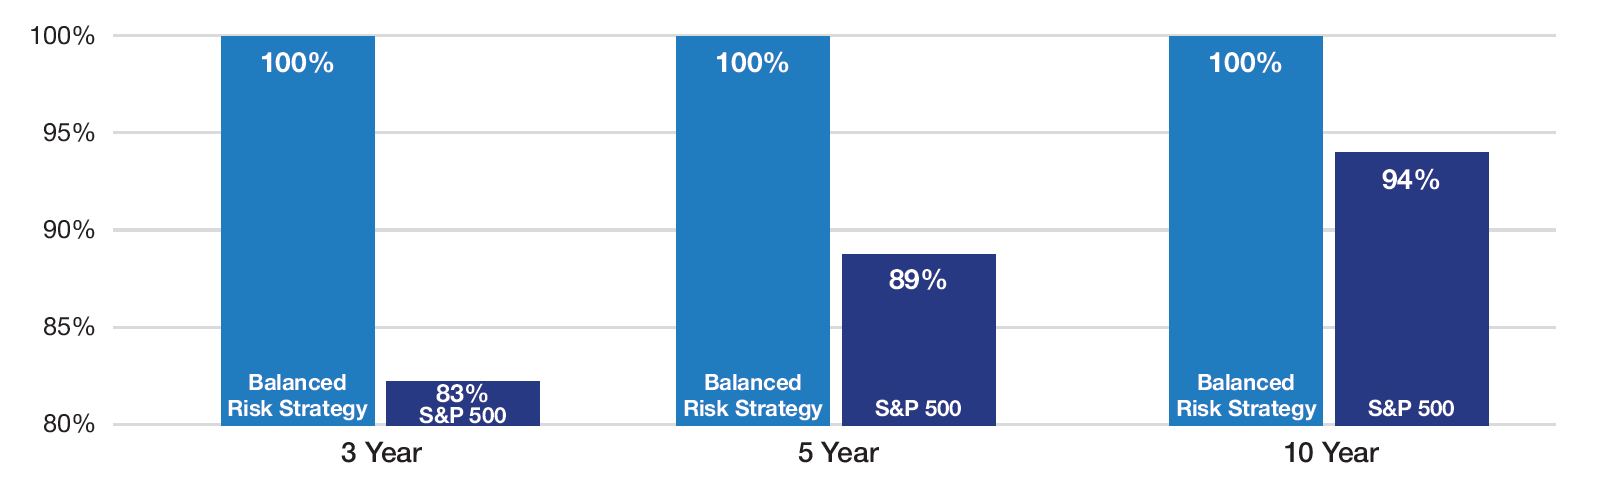
The ability of a hybrid strategy to play offense and defense has resulted in more consistent returns.
Data source: Bloomberg LP and Catalyst Capital Advisors LLC. Based on monthly return data from 12/31/1999 to 12/31/2025. Balanced Risk Strategy represented by 100% notional exposure to SG CTA Trend Index, 50% allocation to the S&P 500 and a 50% allocation to the Bloomberg US Short Treasury TR Index (to represent collateral for futures program), rebalanced monthly. Past performance does not guarantee future results. See important disclosures at the end of this presentation, including with respect to the limitations inherent to hypothetical performance comparisons.
Building a risk-balanced portfolio begins with understanding balanced risk.
Learn more by reading our other balanced risk papers, Defining Alternatives, Goals and Integration of Liquid Alternatives, and The Math of Diversification, or by visiting CatalystMF.com and RationalMF.com for additional information about our full product lineup and how our alternatives can help provide your clients with diversification benefits.
IMPORTANT DISCLOSURES
YOU SHOULD CAREFULLY CONSIDER THE INVESTMENT OBJECTIVES, RISKS, CHARGES AND EXPENSES OF LIQUID ALTERNATIVE INVESTMENT FUNDS. THIS AND OTHER IMPORTANT INFORMATION ABOUT ANY SUCH FUND IS CONTAINED IN THE FUND’S PROSPECTUS, WHICH CAN BE OBTAINED BY CALLING 866.447.4228 OR AT WWW.CATALYSTMF.COM OR WWW.RATIONALMF.COM, AS APPLICABLE. THE RELEVANT PROSPECTUS SHOULD BE READ CAREFULLY BEFORE INVESTING. BOTH THE CATALYST FUNDS AND THE RATIONAL FUNDS ARE DISTRIBUTED BY NORTHERN LIGHTS DISTRIBUTORS, LLC, MEMBER FINRA/SIPC. NEITHER CATALYST CAPITAL ADVISORS, LLC NOR RATIONAL ADVISORS, INC. ARE AFFILIATED WITH NORTHERN LIGHTS DISTRIBUTORS, LLC.
Risk Considerations
Though the objectives, strategies and assets traded may differ significantly across liquid alternative approaches, investing in liquid alternatives generally carries certain risks. These risks may include, but are not necessarily limited to, the following: Certain funds may invest a percentage of their assets in derivatives, such as futures and options contracts. The use of such derivatives and the resulting high portfolio turn-over may expose such funds to additional risks that they would not be subject to if they invested directly in the securities and commodities underlying those derivatives. These funds may experience losses that exceed those experienced by funds that do not use futures contracts, options and hedging strategies. Investing in commodities markets may subject a fund to greater volatility than investments in traditional securities. Currency trading risks include market risk, credit risk and country risk. Foreign investing involves risks not typically associated with U.S. investments. Changes in interest rates and the liquidity of certain investments could affect a fund’s overall performance. Other risks include U.S. Government securities risks and investments in fixed income securities. Typically, a rise in interest rates causes a decline in the value of fixed income securities or derivatives owned by a fund. Furthermore, the use of leverage can magnify the potential for gain or loss and amplify the effects of market volatility on a fund’s share price. All funds are subject to regulatory change and tax risks; changes to current rules could increase costs associated with an investment in a fund.
The value of a fund may decrease in response to the activities and financial prospects of an individual security or group of securities held in a fund’s portfolio. Investments in foreign securities could subject a Fund to greater risks, including currency fluctuation, economic conditions, and different governmental and accounting standards. A fund’s portfolio may be focused on a limited number of industries, asset classes, countries or issuers. Certain funds may invest in high yield or junk bonds, which present a greater risk than bonds of higher quality. Other risks may include credit risks and interest rate risk, particularly with respect to floating rate loan funds. Changes in short-term market interest rates will directly affect the yield on the shares of a fund whose investments are normally invested in floating rate debt. Floating rate loan funds tend to be illiquid, and a fund might be unable to sell the loan in a timely manner as the secondary market is generally a private, unregulated inter-dealer or inter-bank re-sale market.
Any or all of the foregoing risk factors may affect the value of your investment.
Hypothetical Performance Limitations
The blended portfolio returns set forth herein represent a series of differently weighted portfolios comprised of index returns; you cannot invest in indices and no fees taken out of indices; any such blended portfolio returns should be considered hypothetical in nature. You are cautioned that hypothetical performance results have many inherent limitations, some of which are described herein. No representation is being made that any account will or is likely to achieve profits similar to those shown or will not be able to avoid substantial losses. In fact, frequently there are sharp differences between hypothetical performance results and the actual performance results subsequently achieved by a particular portfolio of investments. One of the limitations of hypothetical performance results is that they are generally prepared with the benefit of hindsight. In addition, the construction of a hypothetical portfolio of investments does not involve financial risk, and no hypothetical portfolio of investments can completely account for the impact of financial risk in actual trading. For example, the ability to withstand losses or to adhere to a particular trading program in spite of trading losses are material points which can also adversely affect actual trading results. There are numerous other factors related to the markets in general or the implementation of a portfolio of investments which cannot be fully accounted for in the preparation of hypothetical performance results, all of which can adversely affect actual trading results. You cannot invest directly in an index and unmanaged index returns do not reflect any fees, expenses or sales charges.
Glossary of Index Definitions
S&P 500 Index Total Return: A market-capitalization-weighted index of 500 leading publicly traded companies in the U.S that also includes dividend gains. Bloomberg US Short Treasury Total Return Index: Tracks the market for treasury bills, notes, and bonds issued by the US government. Bloomberg US Aggregate Bond Index: A market capitalization-weighted index that is designed to measure the performance of the U.S. investment grade bond market with maturities of more than one year. SG CTA Trend Index: A subset of the SG CTA Index and follows traders of trend following methodologies.

