
Q3 2026 Market Outlook: Navigating a More Demanding Market
The Macro View: Resilience Meets Rising Complexity
By David Miller, Co-Founder and Chief Investment Officer, Catalyst Capital Advisors LLC and Rational Advisors, Inc.
Commentary as of July 13, 2026
As we enter the third quarter, the U.S. economy remains resilient, but the margin for error has narrowed. This does not look like a classic recessionary environment, but it also no longer looks like a clean, easy soft landing story. The better description is an economy that is still expanding, but with more uneven momentum, more persistent inflation pressure, and a Federal Reserve that has less flexibility than many investors hoped for earlier in the year.
The consumer remains the key pillar of the expansion. Spending has held up better than expected, supported by employment, wage growth, and household balance sheets that are still relatively healthy in many segments. However, the consumer is also becoming more selective. Higher prices, higher borrowing costs, and the cumulative impact of the last several years of inflation are clearly weighing on lower and middle income households. The most important consumer question for the second half of the year is not simply whether spending continues, but where it continues. The spending backdrop is becoming more bifurcated, with higher income consumers still in relatively strong shape while more rate sensitive and price sensitive consumers are showing signs of fatigue.
The labor market is also moving into a different phase. It is no longer as tight as it was during the post pandemic reopening period, but it has not collapsed. Job growth has slowed, wage growth has moderated, and companies appear more cautious in their hiring plans. That is exactly the type of labor market transition investors should watch carefully. A cooler labor market helps reduce inflation pressure, but it also leaves the economy more vulnerable if confidence, profit margins, or credit conditions weaken further. For now, the labor market remains supportive of growth, but it is no longer providing the same powerful tailwind it did over the last few years.
The Fed’s Inflation Battle: Not Over Yet
Inflation remains the central macro challenge. The major improvement from the peak inflation period is already behind us, and the final move back toward the Federal Reserve’s 2% target is proving more difficult. Goods inflation has improved, but services inflation, housing-related costs, wages, insurance, energy volatility, and geopolitical supply risks all remain important issues. This is not the same inflation cycle as 2021 and 2022, but inflation is still too high for the Fed to declare victory. Investors should be careful about assuming that the Fed will quickly return to aggressive easing unless the economic data deteriorates meaningfully.
That leaves the Federal Reserve in a difficult position. Growth is slowing enough to warrant caution, but inflation is still sticky enough to prevent an easy pivot. The Fed would likely prefer to eventually reduce rates, but the data has not given it a clean path to do so. If inflation remains elevated, the Fed may be forced to keep policy restrictive for longer. If growth weakens more sharply, the Fed could gain room to cut, but that would likely come alongside greater pressure on corporate earnings and risk assets. This is why the current setup is so challenging: good economic news can keep inflation concerns alive, while bad economic news can raise recession concerns.
Corporate America remains in better shape than many expected. Balance sheets are generally healthy, profit margins have held up reasonably well, and the largest companies continue to generate significant cash flow. One of the most important supports for the economy is the ongoing capital spending cycle tied to artificial intelligence, automation, data centers, semiconductors, energy infrastructure, and productivity-enhancing technology. This investment cycle has helped offset some of the drag from higher rates. It has also created a meaningful divergence in the market between companies directly benefiting from these trends and companies more exposed to slower consumer demand or higher financing costs.
“Q3 may be defined less by recession, and more by the tension between resilient growth, sticky inflation, and a Fed that cannot easily rescue markets unless conditions worsen.”
—David Miller, CIO
Navigating Market Risks
At the same time, there are real risks investors should not ignore. Fiscal deficits remain large, Treasury issuance remains elevated, and the bond market is increasingly sensitive to inflation surprises and supply concerns. Geopolitical risks also remain significant, particularly around energy markets, global trade, and the Middle East. These factors can quickly change the inflation and interest-rate outlook. In an environment where valuations in parts of the equity market are already elevated, unexpected shocks can lead to sharper volatility.
Globally, the picture remains uneven. The U.S. continues to look relatively stronger than many other developed economies, but global growth is not especially robust. Europe remains challenged by slow growth and energy sensitivity. China continues to face structural issues around property, demographics, and consumer confidence. Emerging markets are highly differentiated, with some benefiting from supply-chain shifts, commodity exposure, and better inflation trends, while others remain vulnerable to dollar strength and global funding conditions. In my view, global diversification still has value, but investors need to be selective rather than assuming broad international exposure will automatically work.
My base case for the third quarter is continued expansion, but with more volatility and greater dispersion beneath the surface. Inflation should gradually moderate if commodity markets remain stable, but the path lower is likely to be uneven. Growth should remain positive, but slower. The Fed should remain data dependent, but the bar for meaningful rate cuts appears higher than it was earlier in the year. That combination argues against making aggressive all-or-nothing macro bets.
From a portfolio perspective, I believe this environment favors balance, selectivity, and discipline. Investors can still be rewarded for owning risk assets, but the easy part of the cycle is likely behind us. Quality should matter more. Pricing power should matter more. Balance sheet strength, durable cash flow, recurring revenue, and real earnings growth should matter more. Income also remains valuable while short-term rates are elevated. Real assets and inflation-sensitive exposures may continue to play an important role as protection against supply shocks, geopolitical uncertainty, and persistent inflation risk. Alternatives and hedged strategies may also be useful in an environment where the traditional stock-bond mix can be challenged by inflation volatility.
The Bottom Line
The economy is still growing, but the market environment is becoming less forgiving. I do not believe investors need to be overly defensive, but I do believe they need to be more selective. Q3 may be defined less by recession and more by the tension between resilient growth, sticky inflation, and a Fed that cannot easily rescue markets unless conditions worsen. In that kind of environment, the goal should be to participate in upside while preparing for volatility, and to focus on strategies that do not require a perfect macro outcome to succeed.
Mr. Miller is the Chief Investment Officer of Catalyst Capital Advisors LLC, which serves as the investment adviser to the Catalyst Funds, and Rational Advisors, Inc., which serves as the investment adviser to the Rational Funds.
Q2 2026 Index Returns as of June 30, 2026
| Asset Class and Benchmark | Representative Index | Q2 Return |
|---|---|---|
| U.S. Equities | S&P 500 TR Index | +15.20% |
| U.S. Bonds | Bloomberg U.S. Agg Bond TR Index | +0.67% |
| International Stocks | MSCI EAFE Index | +9.80% |
| Commodities | Bloomberg Commodity TR Index | -8.08% |
Source: Bloomberg & YCharts
Approaching the Next Chapter of the A.I. Trade
Q3 Equity Outlook
By Bruce Miller, CFA, Cory Krebs, CFA, and Luke O’Neill, CFA, of Cookson, Peirce, & Co., Inc.
For the second straight year, equity markets soared in the second quarter following a sharp Q1 selloff triggered by geopolitical turmoil. As a follow-on act to the tariff meltdown of 2025, March 2026 brought investors the U.S./Iran conflict. However, a combination of an easing of Middle East tensions, solid economic data, and the “here and now” of the AI infrastructure trade quickly turned investor psychology from mildly bearish to extraordinarily bullish.
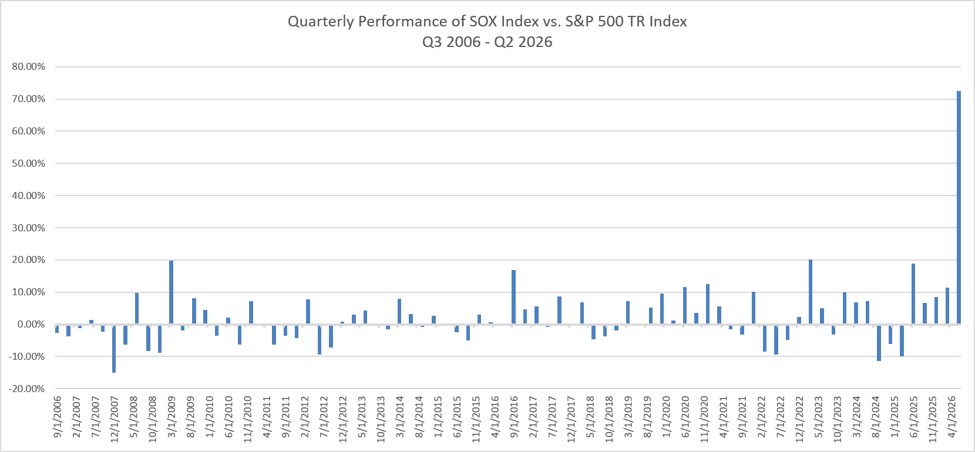
It is hard to overstate the parabolic move in the companies that most directly benefit from the explosion of Capex that is being spent by the hyperscalers. Investors were amazed in 2024 at the $230B of Capex spent by GOOGL, MSFT, AMZN, META and ORCL, but these companies have now guided toward over $750B for 2026, the largest outlay of capital (as a percent of GDP) since the building of the railroads. Semiconductors have been the leading beneficiary, with the SOX Index up a whopping 88% for the quarter. Memory chips in particular have been front and center, with Micron (a top 10 position in our strategy) soaring 242% for the quarter. But it hasn’t been the semis alone. From networking equipment to optical fiber, hardware stocks have been star attractions, and industrial stocks focused on electrification and power generation have soared alongside their tech siblings.
The Next Chapter
Looking ahead, the key questions circle around the “next chapter” after such an outsized move. Much of the answer to this question revolves around timeframes. In the short term, it is impossible to expect such a move to continue. Extreme price moves, by definition, must moderate at some point, and while the timing of that moderation (or reversal) is always uncertain, wisdom dictates some caution in the near term. The AI thesis has proven to be a smashing success, but it’s highly unlikely that such verticality continues unabated without a notable pullback or consolidation.
With a wider lens, however, the backdrop that supports this meteoric move shows no signs of slowing down. Hyperscaler spending is projected to increase to at least $1 trillion in 2027. Forecasts from picks and shovels beneficiaries show increasing backlogs and hardly an ounce of caution. Micron’s projected 2027 earnings are 1,200% higher than any pre-2026 calendar year. The explosion in stock price, while parabolic and likely to consolidate in the near term, is backed by a similar explosion of underlying fundamentals, a stark contrast to 2021’s meme stock rally or the unprofitable tech of the dot-com bubble.
The valuation risk for many AI infrastructure companies is real; more importantly, the fundamental risk of AI’s inference and deep reasoning tasks becoming more efficient is a near certainty. Thus, perhaps the most critical question: Even as per-unit costs of compute will assuredly fall, will total consumption of compute actually rise? If history is any guide, cheaper and more efficient compute will not lower total spending; it will unlock a massive wave of new software enterprise demand that was previously cost-prohibitive.
Finally, after years of megacap dominance, the first six months of 2026 saw the average Mag7 stock return -1.8%, compared to the S&P 500 TR index return of +10.19%, while the small cap Russell 2000 Index was up +22.57%. We believe the democratizing impact of AI will enhance productivity across companies of all sizes but that the impact may be most keenly observed in small and mid caps. Combined with the steep valuation discount offered down market cap, this broadening trade should continue to be a tailwind to investors who purposely diversify across the market cap spectrum.
Navigating a Bond Market That Rewards Discipline
Q3 Fixed Income Outlook
By Ira Ginsburg, Rick Lam, CFA, Mike Nespola, CFA, and Natalia Lojevsky, CIFC Investment Management, LLC
The first half of 2026 posed two questions that have hung over credit markets since January. As the second half opens, neither has fully settled. The energy shock that drove headline inflation to a three-year high looked to be easing as a 60-day ceasefire reopened the Strait of Hormuz and crude gave back much of its war premium. But that ceasefire has proven fragile, and with it the quick disinflation it promised. The Federal Reserve, under Kevin Warsh’s new chairmanship, held rates steady, set forward guidance aside, and published projections whose median now points to a hike rather than a cut. “Higher-for-longer” has moved from market expectation to stated intent. Core inflation, meanwhile, held sticky near 3%, leaving little to pull the Fed off its hawkish path.
Loan Market Performance
Against that unsettled backdrop, the senior secured corporate loan market posted its softest first half in four years, though the weakness was largely technical rather than fundamental. Software was the epicenter. The AI-driven repricing that first hit the sector in late January spilled from equities into loans, where a muted CLO bid and ongoing BDC redemptions left fewer buyers to meet the selling. Yet the strain was contained. The rest of the loan market held firm, and double-B loans posted gains in every month of the year.
The question for credit investors is no longer how much risk to carry but which risk to own. The top-down macro trade that set the terms through the first half has largely run its course. The two forces that weighed on loan prices last quarter now point in opposite directions. The technical side is likely to stay challenged. The CLO arbitrage remains below target, net new supply skews toward tight, higher-rated paper, and BDC flows may stay pressured. The structural bid that cushioned the market is thin for the time being, and slow to mend. The fundamental side points the other way. Second-quarter earnings should begin to separate credits caught in indiscriminate selling from those facing genuine deterioration, most consequentially in Software. The market has drawn its sharpest line there: a bid gap to the rest of the market now at 11 points, the widest of the cycle, and a share of new issuance at its lowest since 2013. In our view, the market has painted a complex sector with one brush, treating mission-critical platforms and replaceable point solutions as a single trade. Earnings are the test of that distinction, and we expect a solid Q2 season to serve as a positive catalyst, particularly for the mispriced credits swept up in the selling.
The more cautious view across the market reads this same weakness as a default cycle beginning to gather, pointing to the 2028 maturity wall and a distressed tail near cycle highs. That wall is a genuine forward risk, and one we watch closely. But we do not read this quarter’s price action as the wall arriving early. The selling was technical, not a fundamental credit signal. The realized picture remains relatively benign, with the headline default rate easing below 1% and recent months producing no new defaults at all. The gap between a placid index and a stressed tail is not a systemic warning. It is an opportunity, and it rewards selection over exposure.
Positioning in an Uncertain Environment
Our response to this environment is not to predict which way the risks break, but to build a portfolio that can withstand them. We favor a defensively biased, up-in-quality book, one that earns its carry while the dispersion resolves. All-in yields above 8% provide that compensation, and the floating-rate structure keeps it durable across whatever path rates take. That same opportunity should begin to draw retail flows back toward the asset class, a source of demand that would help firm the technical dynamic. We have used the bouts of weakness to move further up in quality, adding selectively in higher-rated paper and leaning on new issue for incremental carry. That positions us for a credit recovery without wagering that the CLO bid firms alongside it. The risks are real and we hold them in view: commodity-linked credits, exposed again as energy volatility returns; the lowest-rated borrowers approaching the 2028 wall; and any renewed geopolitical or inflation surprise of the kind the first half delivered. The discipline-and-dispersion frame we have carried since late 2025 comes into its own this quarter. As the top-down trade gives way, disciplined credit selection is no longer only a defense, it is the source of return.
The Bottom Line
For the year ahead, that means staying invested in credit, emphasizing quality and structure, embracing risk for which you are potentially being compensated, and leaning into dispersion opportunities where available, all while maintaining risk management and disciplined underwriting as guiding principles.
CIFC Asset Management is the sub-advisor to the Catalyst/CIFC Senior Secured Income Strategy.
*Quality ratings reflect the credit quality of the underlying securities in the Fund’s portfolio and not that of the Fund itself. Quality ratings are subject to change. Moody’s assigns a rating of AAA as the highest to C as the lowest credit quality rating.
Converting A.I. Investments Into Opportunity
Spotlight on Convertibles
By Frank Timons, CEO, Pier 88 Investment Partners
Convertible bonds have generally outperformed other fixed income asset classes year-to-date, driven by a group of names levered to the AI trade. Investors appear to have focused more on the potential growth and productivity gains from AI over the macro shocks of the Iran conflict and knock-on effects from higher gas prices. Micro factors ruled the day as markets seemed to reward companies where underlying business fundamentals remained strong and the prospects for positive future earnings revisions drove valuations. Convertible bonds offer an attractive attribute in that they offer the potential for equity upside participation with some fixed income downside protection. We believe the asset class should continue to perform well into the second half of the year given the asset class is levered to the AI theme as technology companies issue convertibles to fund the AI build out.
The following chart* of over a dozen fixed income indices and the S&P 500 Index is illustrative:
| Ticker | Index | 2026 YTD as of 6.26.26 |
|---|---|---|
| LGTRTRUU Index | Global Aggregate – Treasuries | -0.78% |
| LUMSTRUU Index | U.S. Mortgage Backed Securities | 1.41% |
| LG30TRUU Index | Global High Yield | 1.92% |
| LEGATRUU Index | Global Aggregate | -0.10% |
| LF98TRUU Index | U.S. Corporate High Yield | 1.75% |
| LD08TRUU Index | U.S. Aggregate: Government-Related | 0.99% |
| LUATTRUU Index | U.S. Treasury | 0.65% |
| LBEATRUU Index | Euro-Aggregate | 1.36% |
| LC07TRUU Index | U.S. Universal | 1.09% |
| LBUSTRUU Index | U.S. Aggregate | 0.98% |
| EMUSTRUU Index | EM USD Aggregate | 2.06% |
| LP06TREU Index | Pan-Euro Aggregate | 1.40% |
| LF94TRUU Index | Global Inflation-Linked | 0.27% |
| LUGCTRUU Index | U.S. Gov/Credit | 0.84% |
| LGDRTRUU Index | Global Aggregate-Credit | 0.19% |
| LUACTRUU Index | U.S. Corporate Investment Grade | 1.19% |
| VX5C Index | All US IG With Cap 5% | 7.51% |
| VECEZ5C Index | ICE Core Eurozone Convertible 5% Constrained | 6.41% |
| SPX Index | S&P 500 Index | 8.04% |
*Source: Bloomberg & Pier 88 Research June 27, 2026.
As the chart depicts, convertibles outperformed the other fixed income classes year to date in 2026. Interestingly, investment grade convertibles (VX5C) outperformed high yield names, despite having higher credit quality. One would expect a higher credit profile security to be generally more defensive, and lag in a strong tape. On the contrary, year-to-date the higher quality credit convertibles outperformed their lower credit asset classes during the rally. Investment grade convertibles delivered 93% of the S&P’s return in the 1st half of the year.
Despite volatile markets, convertible bond performance remained fairly resilient. Companies levered to secular and cyclical tailwinds delivered solid Q1 earnings and positive outlooks. The stocks responded positively and the highly correlated convertible bonds participated in the rally. The delta of a convertible bond describes the correlation of the moves between a convertible bond and its companion underlying equity. The move of the convertible bond is typically proportional to the level of delta. In the second quarter, convertibles with high deltas and exposure to stocks levered to the AI infrastructure trade demonstrated strong performance. On the contrary, convertibles with low deltas or levered to out of favor sectors lagged.
We believe long-term business fundamental trends ultimately drive equity and convertible performance. Internal research suggests that the long-term capital appreciation of a convertible is tied to the growth in the value of the underlying equity. If a company grows its business and the market rewards that company with a higher equity valuation, the price of the convertible bond typically follows the path of the appreciating equity. Many companies issuing convertibles are levered to powerful secular growth trends across the economy. Those positive secular trends should bode well for the asset class.
The capital markets have been active with new issuances as companies leverage convertibles as a cheaper financing vehicle than traditional equity, and a primary tool to de-lever at a lower interest rate. There has been over $92bn of new volumes issued year-to-date with approximately 60% of that issuance in the US. The pace of deals is running about 2x over 2025. (Source: BofA Global Research June 1, 2026). Market demand for convertibles has been strong the last several years and the asset class is attracting new issuers across a variety of sectors. The AI infrastructure theme has been a major driver of new issuance. Healthcare and biotech have also seen strong issuance. Primary activity in June was very strong and a standout deal was a $19.3bn mandatory issued by GOOGL to help fund Alphabet’s AI investments.
Bottom Line
The market is rewarding companies levered to strong secular tailwinds like the build-out of AI infrastructure and datacenters. We believe investors will continue to migrate to convertibles as a way to gain exposure to these powerful trends with an asset class that offers the potential for upside participation with downside protection.
Important Disclosures
Past performance is not a guarantee of future results.
Investors should carefully consider the investment objectives, risks, charges, and expenses of liquid alternative funds, including the Catalyst Funds and the Rational Funds. This and other important information about a fund is contained in the applicable prospectus, which can be obtained by calling 866-447-4228 or at www.catalystmf.com or www.rationalmf.com, as applicable. The relevant prospectus should be read carefully before investing.
Both the Catalyst Funds and the Rational Funds are distributed by Northern Lights Distributors, LLC (“NLD”). NLD has had no role in the structuring or distribution of any other investment products referenced herein, and is not responsible for the marketing or promotional material related to the other investment products produced or sponsored by any other firm. David Miller, Bruce Miller, Cory Krebs, Luke O’Neill, Ira Ginsburg, Rick Lam, Mike Nespola, Natalia Lojevsky, Frank Timons, Catalyst Capital Advisors, Rational Advisors, Pier 88, and CIFC Asset Management are not affiliated with NLD and Ultimus Fund Solutions.
Risk Considerations
Though the objectives, strategies and assets traded may differ significantly across liquid alternative approaches, investing in liquid alternatives generally carries certain risks. These risks may include, but are not necessarily limited to, the following: Certain funds may invest a percentage of their assets in derivatives, such as futures, forwards, options, and swaps contracts, as well as hedging strategies. The use of such derivatives and the resulting high portfolio turn-over may expose such funds to additional risks that they would not be subject to if they invested directly in the securities and commodities underlying those derivatives. These funds may experience losses that exceed those experienced by funds that do not use futures, forwards, options, and swap contracts, as well as hedging strategies. Investing in commodities markets may subject a fund to greater volatility than investments in traditional securities. Currency trading risks include market risk, credit risk and country risk. Foreign investing involves risks not typically associated with U.S. investments. Changes in interest rates and the liquidity of certain investments could affect a fund’s overall performance. Other risks include U.S. Government securities risks and investments in fixed income securities. Typically, a rise in interest rates causes a decline in the value of fixed income securities or derivatives owned by a fund. Furthermore, the use of leverage can magnify the potential for gain or loss and amplify the effects of market volatility on a fund’s share price. All funds are subject to regulatory change and tax risks; changes to current rules could increase costs associated with an investment in a fund.
The value of a fund may decrease in response to the activities and financial prospects of an individual security or group of securities held in a fund’s portfolio. Investments in foreign securities could subject a Fund to greater risks, including currency fluctuation, economic conditions, and different governmental and accounting standards. A fund’s portfolio may be focused on a limited number of industries, asset classes, countries or issuers. Certain funds may invest in high yield or junk bonds, which present a greater risk than bonds of higher quality. Other risks may include credit risks and interest rate risk, particularly with respect to floating rate loan funds. Changes in short-term market interest rates will directly affect the yield on the shares of a fund whose investments are normally invested in floating rate debt. Floating rate loan funds tend to be illiquid, and a fund might be unable to sell the loan in a timely manner as the secondary market is generally a private, unregulated inter-dealer or inter-bank re-sale market.
Any or all of the foregoing risk factors may affect the value of your investment.
The views expressed herein are as of July 14, 2026, and represent a general guide to the perspectives of the authors. The information and opinions contained in this document have been compiled or arrived at based on sources believed to be reliable and in good faith; however, no representations or warranties of any kind are intended or should be inferred with respect to the accuracy of the information contained herein or the economic return of an investment in a fund, and no assurance can be given that existing laws will not be changed or interpreted adversely. All such information and opinions are subject to change without notice.
Some of the statements in this presentation may contain or be based on forward looking statements, estimates, targets or prognoses (collectively, “forward looking statements”), which reflect the advisor’s current view of future events, economic developments and financial performance. Such forward looking statements are typically indicated by the use of words which express an estimate, expectation, belief, target or forecast. Such forward looking statements are based on an assessment of historical economic data, on the experience and current plans of the advisor and/or certain of its advisors, and on the indicated sources. These forward looking statements contain no representation or warranty of whatever kind that such future events will occur or that they will occur as described herein, or that such results will be achieved by any fund or the investments of any fund, as the occurrence of these events and the results of a fund are subject to various risks and uncertainties. The actual portfolio, and thus results, of a fund may differ substantially from those assumed in the forward looking statements. The opinions expressed reflect the advisor’s best judgment at the time this presentation was issued, and the advisor and its affiliates will not undertake to update or review the forward looking statements contained in this presentation, whether as a result of new information or any future event or otherwise.
The advisor’s judgments about the growth, value or potential appreciation of an investment may prove to be incorrect or fail to have the intended results, which could adversely impact a Fund’s performance and cause it to underperform relative to other funds with similar investment goals or relative to its benchmark, or not to achieve its investment goal.
There is no assurance that these opinions or forecasts will come to pass, and past performance is no assurance of future results.
There is a risk that issuers and counterparties will not make payments on securities and other investments.
Glossary
BDC (Business Development Company) is a publicly traded investment company that supplies capital to small and mid-sized private businesses, particularly those with limited access to conventional bank financing or public markets.
Beta is a measure of a stock or portfolio’s volatility in relation to the overall market.
Bloomberg Commodity TR Index is designed to be a highly liquid and diversified benchmark for commodity investments.
Bloomberg US Aggregate Bond TR Index is a market capitalization-weighted index that is designed to measure the performance of the U.S. investment grade bond market with maturities of more than one year.
CapEx (Capital Expenditure) refers to funds a company uses to purchase, improve, or preserve long-term physical assets that support its operations and future growth.
CLO (Collateralized Loan Obligation) are structured credit products backed by a portfolio of leveraged loans, with investor interests divided into debt and equity layers that carry different risk and return profiles.
Commodities are a basic good used in commerce that are interchangeable with other commodities of the same type. Investors and traders can buy and sell commodities directly in the spot (cash) market or via derivatives such as futures and options.
Correlation is the statistical measure of how two securities move in relation to each other.
Credit Spreads are the difference in yield (return) between two debt instruments of the same maturity but with different credit ratings, reflecting the additional risk investors take on when lending to a borrower with a lower credit rating.
Currencies are money in the form of paper and coins that’s used as a medium of exchange. Currencies are created and distributed by individual countries around the world.
Duration is a measure of a bond’s sensitivity to changes in interest rates.
Large Cap is a company with market capitalization of $10 billion or more.
Megacap refers to companies with extremely large market capitalizations, typically at the top of the equity markets.
Mid Cap is a company with a market capitalization typically ranging from $2 billion to $10 billion.
MSCI EAFE Index is a broad market equity index that tracks the performance of large and mid-cap companies in 21 developed markets around the world, excluding the US and Canada.
S&P 500 TR Index is a market capitalization-weighted index that is used to represent the U.S. large-cap stock market.
Small Cap is a company with a market capitalization ranging between $250 million and $2 billion.
SOX Index (PHLX Semiconductor Sector Index) is a capitalization-weighted index that is composed of 30 semiconductor companies.
Download PDF

