
The Math of Diversification
February 2026
Building a Risk-Balanced Portfolio for Volatile Markets
The Math of Diversification
Integrating Alternative Investments Requires an Analytical Approach
Examining Efficient Frontier, Managed Futures, Drawdown, and Correlation
We believe an allocation to alternatives offers investors diversification and exposure to a universe that can perform independent of stocks and bonds during market struggles.
Determining the size of the allocation requires an analytical approach. The amount must be significant enough for the liquid alternative to achieve its intended goals across the entire portfolio while still meeting the client’s return targets.
|
As an example, a 1% allocation to an alternative that thrives in bear markets may have limited overall impact. |
While a 50% allocation to that same alternative would likely dramatically reduce long-term returns. |
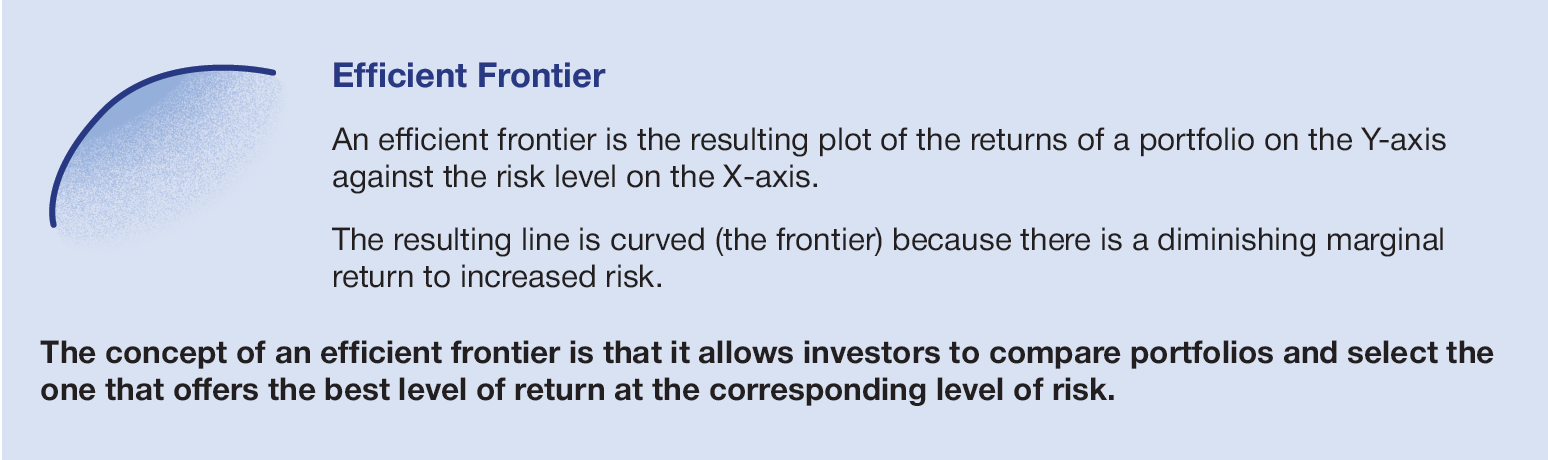
In seeking to focus on an analytical approach, we suggest starting with the efficient frontier.
The chart on the following page presents a series of portfolios allocated between stocks and bonds (darker blue series). It then presents a starting 60/40 stock/bond portfolio and reduces the stocks and bonds on a pro rata basis to allocate to a balanced risk, or hybrid, strategy (as previously discussed and further expanded upon herein), with increasing allocations to the balanced risk strategy (lighter blue series).
Efficient Frontier: A Case for Allocating 10% to 20% of a Portfolio to a Balanced Risk Strategy
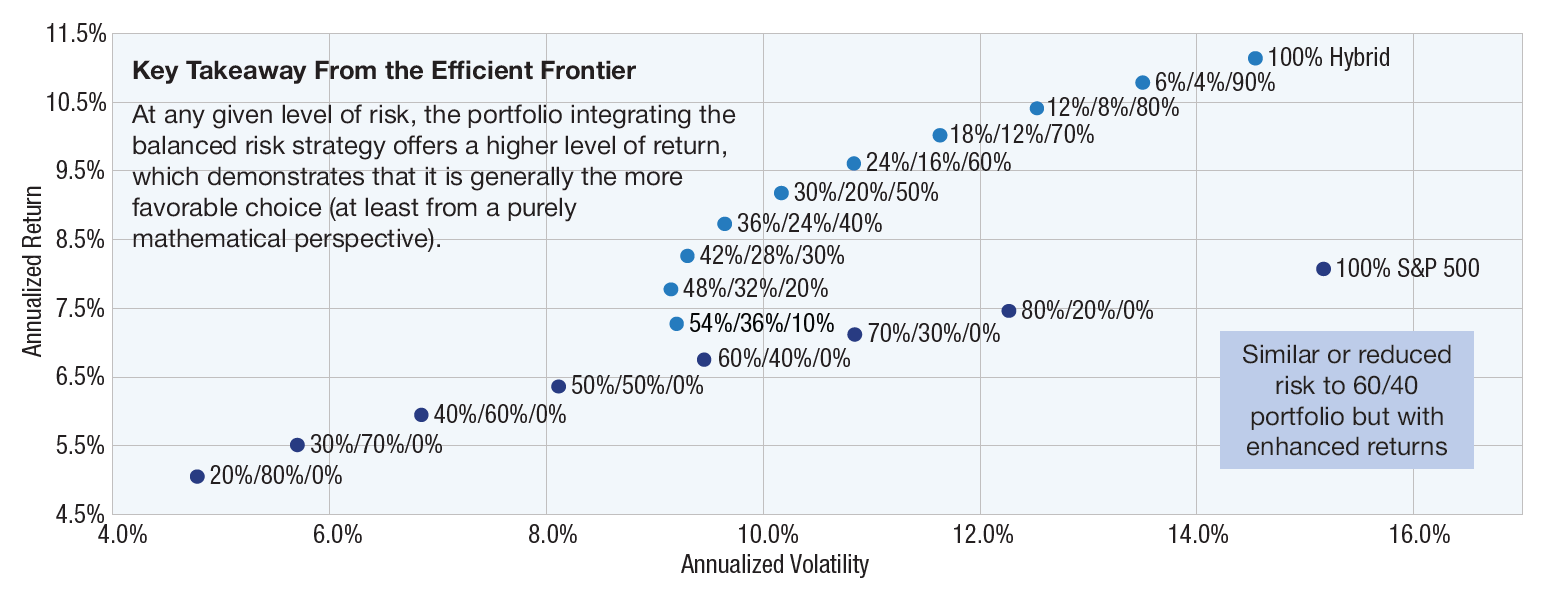
Data Source: Bloomberg LP and Catalyst Capital Advisors LLC. Based on monthly return data from 12/31/1999 to 12/31/2025. Stocks are represented by the S&P 500 TR Index; bonds are represented by the Bloomberg US Aggregate Bond Index; Balanced Risk Strategy (or Hybrid) is represented by 100% notional exposure to SG CTA Index, 50% allocation to the S&P 500, and 50% allocation to the Bloomberg US Short Treasury TR Index (to represent collateral for futures program). Rebalanced monthly. Past performance does not guarantee future results. See important disclosures at the end of this presentation, including with respect to the limitations inherent to hypothetical performance comparison.
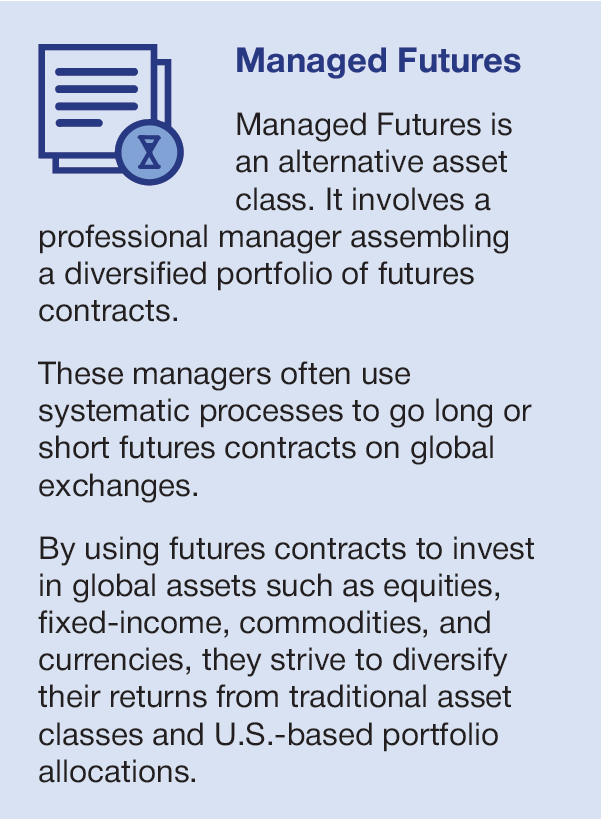
Managed Futures: A Building Block of Balanced Risk Strategies
 |
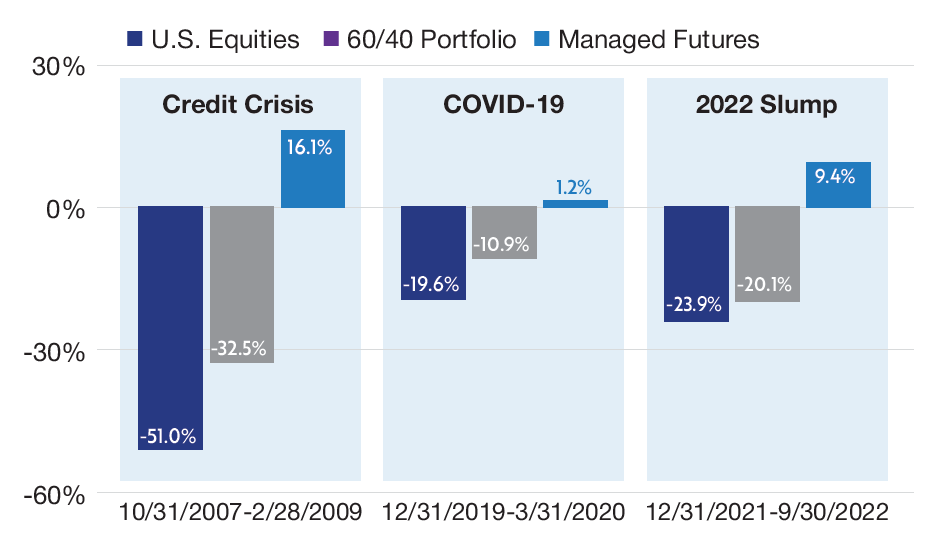
This chart compares the performance of U.S. equities and that of a traditional 60/40 portfolio to an alternative managed futures index during recent bear markets.
Source: Catalyst Capital Advisors LLC and Bloomberg LP. U.S. Equities represented by the S&P 500 Total Return Index. 60/40 Portfolio represented by 60% S&P 500 TR Index and 40% Bloomberg U.S. Aggregate TR Bond Index. Managed Futures represented by the BarclayHedge BTOP50 Index. |
Our Experts Explain Managed Futures
While traditional asset classes exhibited significant drawdowns during periods of stock market turmoil, managed futures demonstrated stronger, positive performance.
If an investor had allocated a portion of their portfolio to managed futures during the bear markets shown in the prior chart, they would have experienced less severe drawdowns and may have been able to capitalize on gains when market volatility subsided.
Managed futures offer an effective way for investors to hedge their portfolios during times of market uncertainty, notes Emmett Fitzgerald, Head of U.S. Business Development and Strategy at Aspect Capital.
For those uncertain about entering this space, Fitzgerald notes that while it may seem new to clients, managed futures are a time-tested approach.
“
The industry has a long history stretching back to the late 1940s. Since then, the technology and techniques used to capture market effects have evolved, but the drivers of these effects, such as human behavioral biases, have generally remained a persistent feature of markets. I’d advise entering the space with a manager with history and experience, one which has successfully navigated a wide range of market environments and demonstrated robust risk management.
Emmett Fitzgerald, Aspect
Michael Sherbert, Managing Director at Millburn Ridgefield Corporation, notes that while traditional stock/bond portfolios have served investors well over the long-run, it’s not a foolproof system since there are times when these asset classes are correlated. Introducing managed futures adds another element and return stream.
Millburn utilizes machine-learning techniques in managed futures investing, which seek to remove the human bias from investing and adapt to changing environments based on the systematic observation and analysis of historical market cycles.
“
Managed futures offer the potential to increase diversification, accessing global markets across a range of asset classes outside of equity and fixed income, including currency and commodity markets. And unlike some other alternative investments, managed futures are typically very liquid with full price transparency.
Michael Sherbert, Millburn
In terms of discussing managed futures with clients new to the space, Sherbert says to look at the investment from two perspectives: as a stand-alone investment and in the context of their overall portfolio.
“
Make sure you understand the function of the investment in the portfolio. This will give you the confidence to stick with it and enable you to realize any potential long-term benefits.
Michael Sherbert, Millburn
Returns Versus Worst Drawdowns: Highlighting the Value That a Balanced-Risk Strategy Can Add to a Portfolio in Mitigating Pain Points

Data source: Bloomberg LP and Catalyst Capital Advisors LLC. Based on monthly return data from 12/31/1999 to 12/31/2025. Balanced Risk Strategy represented by 100% notional exposure to SG CTA Trend Index, 50% allocation to the S&P 500 and a 50% allocation to the Bloomberg US Short Treasury TR Index (to represent collateral for futures program), rebalanced monthly. Past performance does not guarantee future results. See important disclosures at the end of this presentation, including with respect to the limitations inherent to hypothetical performance comparisons.
Combining Uncorrelated Assets is Key to Maximizing the Benefits of Diversification
The formula for returns is relatively straightforward: the expected return is the weighted average of returns of the investments in the portfolio. For example, if you combine 10 investments each with an 8% expected return, then the portfolio’s expected return is 8%.
Nobel Laureate investor, Harry Markowitz, demonstrated that portfolio volatility could be reduced by diversifying investments, and that maximum benefits could be achieved when the correlation between investments is zero. In other words, if you combine 10 investments, each with a 15% expected volatility, in a portfolio and they are not completely correlated, then the expected portfolio volatility is reduced to less than 15%. By reducing the expected portfolio volatility, the probability of a negative year decreases and the return per risk taken increases.
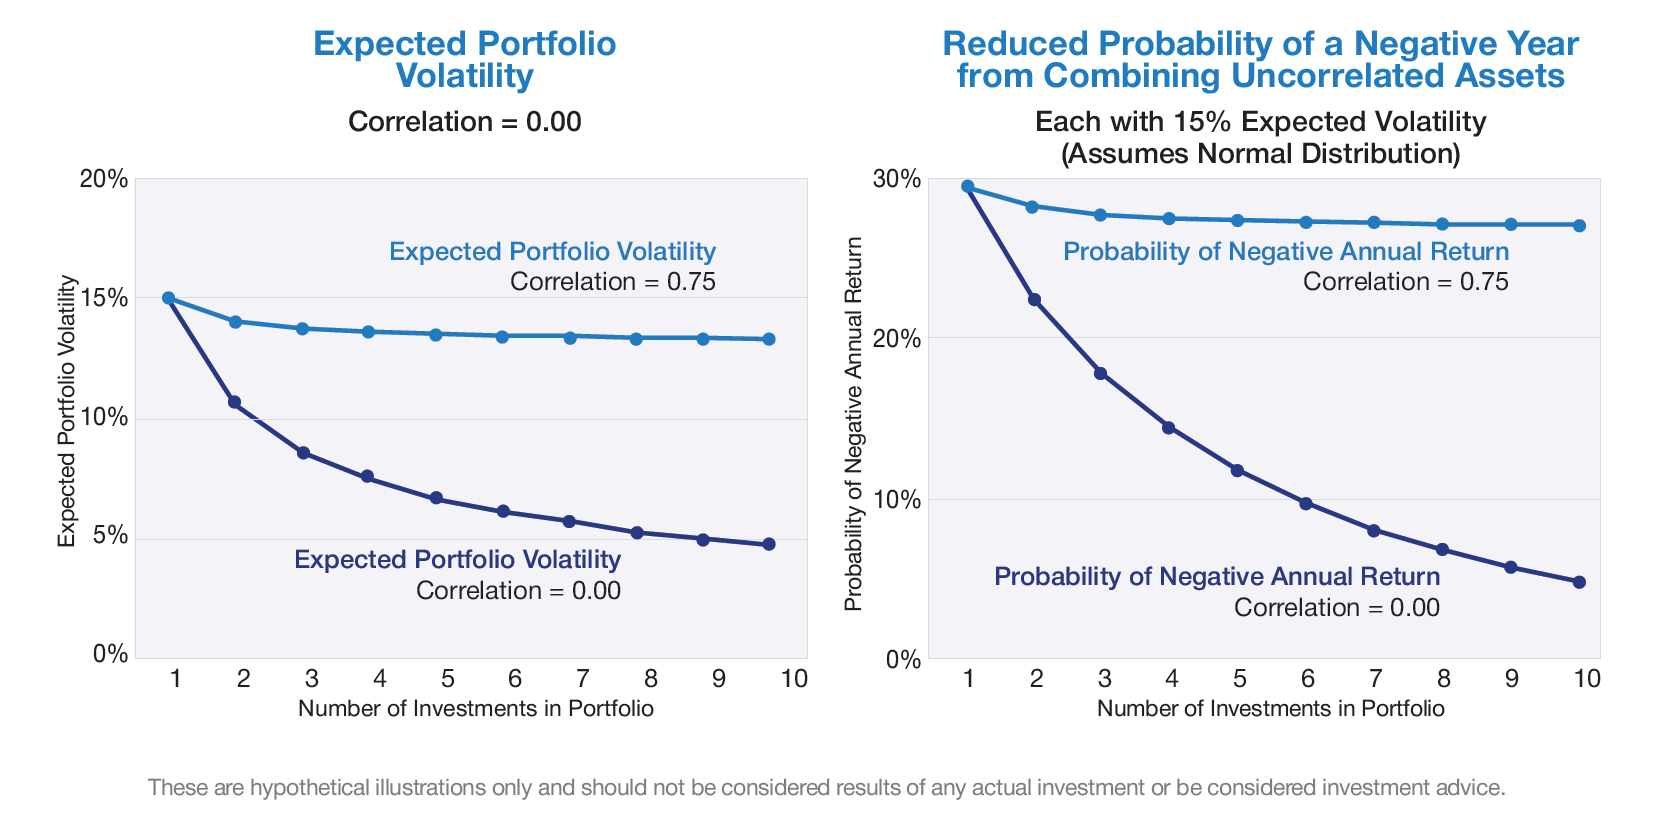
The following charts graphically present the mathematical outcomes of Markowitz’s work, looking at the reduction in expected portfolio volatility and decreased probability of a negative annual return. In the examples, each investment has an 8% expected return, and therefore the expected portfolio return in any scenario is 8%. Each investment also has a 15% expected volatility. There are two series: one series showing a portfolio with investments that all have a correlation of zero to each other, meaning that there is no predictive relationship, and a second series where the investments all have a correlation of 0.75 to each other, meaning that there is a reasonable predictive relationship between the two (i.e., U.S. large-cap and U.S. small-cap stocks).
These are hypothetical illustrations only and should not be considered results of any actual investment or be considered investment advice.
These charts demonstrate that by going from one to ten investments in a portfolio, the expected portfolio volatility and the probability of a negative annual return both decrease. If the investments all have a correlation of 0.75 to each other, the reduction is relatively minimal. Going from one investment to ten investments each with a correlation of 0.75 to each other only reduces the probability of a negative year from approximately 30% to 27%. On the other hand, if all ten investments have no correlation (correlation = 0.00), then the probability of a negative year drops from approximately 30% to 5% as you go from one to ten investments.
What does this mean? Since alternatives tend to be uncorrelated to traditional markets and, in some instances, to each other, the more alternatives you integrate in a portfolio, the higher the likelihood you can reduce portfolio risk (or enhance portfolio returns at the same level of risk) and reduce the probability of a negative year. Some alternative strategies already combine multiple uncorrelated strategies into one approach, such as managed futures, balanced risk strategies, and systematic alpha strategies.
For financial professionals looking to only use a few alternatives, they may get the most benefit from one of these approaches rather than a single alternative that is just one uncorrelated return stream (such as long/short equities).
How Catalyst Can Help
If you have questions about how to effectively allocate, we are happy to discuss how alternatives can fit within your client portfolios or introduce you to Tyler Wilkens, our Head Portfolio Strategist.
Our teams also invest in areas of fixed income and equity markets that are not typically a focus of other managers – these include commodities, senior secured loans, special situations, tactical approaches, and often overlooked segments of mortgage-backed securities and asset-backed securities markets. We at Catalyst and Rational hope to become an important resource and assist in answering any questions you may have with respect to alternative investments and hope you will use this research paper to help guide your decision-making process.
Understanding the math of diversification is a critical step toward building a risk-balanced portfolio.
Learn more by reading our other papers on balanced risk, Introduction to Balanced Risk, Goals and Integration of Liquid Alternatives, and Defining Alternatives, or by visiting CatalystMF.com and RationalMF.com for additional information about our full product lineup and how our alternatives can help provide your clients with diversification benefits.
IMPORTANT DISCLOSURES
YOU SHOULD CAREFULLY CONSIDER THE INVESTMENT OBJECTIVES, RISKS, CHARGES AND EXPENSES OF LIQUID ALTERNATIVE INVESTMENT FUNDS. THIS AND OTHER IMPORTANT INFORMATION ABOUT ANY SUCH FUND IS CONTAINED IN THE FUND’S PROSPECTUS, WHICH CAN BE OBTAINED BY CALLING 866.447.4228 OR AT WWW.CATALYSTMF.COM OR WWW.RATIONALMF.COM, AS APPLICABLE. THE RELEVANT PROSPECTUS SHOULD BE READ CAREFULLY BEFORE INVESTING. BOTH THE CATALYST FUNDS AND THE RATIONAL FUNDS ARE DISTRIBUTED BY NORTHERN LIGHTS DISTRIBUTORS, LLC, MEMBER FINRA/SIPC. NEITHER CATALYST CAPITAL ADVISORS, LLC NOR RATIONAL ADVISORS, INC. ARE AFFILIATED WITH NORTHERN LIGHTS DISTRIBUTORS, LLC.
Risk Considerations
Though the objectives, strategies and assets traded may differ significantly across liquid alternative approaches, investing in liquid alternatives generally carries certain risks. These risks may include, but are not necessarily limited to, the following: Certain funds may invest a percentage of their assets in derivatives, such as futures and options contracts. The use of such derivatives and the resulting high portfolio turn-over may expose such funds to additional risks that they would not be subject to if they invested directly in the securities and commodities underlying those derivatives. These funds may experience losses that exceed those experienced by funds that do not use futures contracts, options and hedging strategies. Investing in commodities markets may subject a fund to greater volatility than investments in traditional securities. Currency trading risks include market risk, credit risk and country risk. Foreign investing involves risks not typically associated with U.S. investments. Changes in interest rates and the liquidity of certain investments could affect a fund’s overall performance. Other risks include U.S. Government securities risks and investments in fixed income securities. Typically, a rise in interest rates causes a decline in the value of fixed income securities or derivatives owned by a fund. Furthermore, the use of leverage can magnify the potential for gain or loss and amplify the effects of market volatility on a fund’s share price. All funds are subject to regulatory change and tax risks; changes to current rules could increase costs associated with an investment in a fund.
The value of a fund may decrease in response to the activities and financial prospects of an individual security or group of securities held in a fund’s portfolio. Investments in foreign securities could subject a Fund to greater risks, including currency fluctuation, economic conditions, and different governmental and accounting standards. A fund’s portfolio may be focused on a limited number of industries, asset classes, countries or issuers. Certain funds may invest in high yield or junk bonds, which present a greater risk than bonds of higher quality. Other risks may include credit risks and interest rate risk, particularly with respect to floating rate loan funds. Changes in short-term market interest rates will directly affect the yield on the shares of a fund whose investments are normally invested in floating rate debt. Floating rate loan funds tend to be illiquid, and a fund might be unable to sell the loan in a timely manner as the secondary market is generally a private, unregulated inter-dealer or inter-bank re-sale market.
Any or all of the foregoing risk factors may affect the value of your investment.
Hypothetical Performance Limitations
The blended portfolio returns set forth herein represent a series of differently weighted portfolios comprised of index returns; you cannot invest in indices and no fees taken out of indices; any such blended portfolio returns should be considered hypothetical in nature. You are cautioned that hypothetical performance results have many inherent limitations, some of which are described herein. No representation is being made that any account will or is likely to achieve profits similar to those shown or will not be able to avoid substantial losses. In fact, frequently there are sharp differences between hypothetical performance results and the actual performance results subsequently achieved by a particular portfolio of investments. One of the limitations of hypothetical performance results is that they are generally prepared with the benefit of hindsight. In addition, the construction of a hypothetical portfolio of investments does not involve financial risk, and no hypothetical portfolio of investments can completely account for the impact of financial risk in actual trading. For example, the ability to withstand losses or to adhere to a particular trading program in spite of trading losses are material points which can also adversely affect actual trading results. There are numerous other factors related to the markets in general or the implementation of a portfolio of investments which cannot be fully accounted for in the preparation of hypothetical performance results, all of which can adversely affect actual trading results. You cannot invest directly in an index and unmanaged index returns do not reflect any fees, expenses or sales charges.
Glossary of Index Definitions
S&P 500 Index Total Return: A market-capitalization-weighted index of 500 leading publicly traded companies in the U.S that also includes dividend gains. Bloomberg US Short Treasury Total Return Index: Tracks the market for treasury bills, notes, and bonds issued by the US government. Bloomberg US Aggregate Bond Index: A market capitalization-weighted index that is designed to measure the performance of the U.S. investment grade bond market with maturities of more than one year. SG CTA Trend Index: A subset of the SG CTA Index and follows traders of trend following methodologies.
