
When Rates Rise, Convertibles Can Shine
When Rates Rise, Convertibles Can Shine
October 5, 2026
By Frank Timons, Pier 88 Investment Partners
It’s official: the Fed has ushered in a tightening cycle after Fed Chair Kevin Warsh announced a rate hike in September. So, how should investors assess the trade-off between stocks and bonds? We thought an objective, data-driven review of the impact of rising rates would be a good place to start. Historical data suggests equities and investment grade convertible bonds tend to outperform other fixed income asset classes during periods of rising rates. In this paper, we’ll explain why investment grade convertible bonds may be a compelling choice in the current market regime, offering the potential for upside participation with downside protection.
A Strong Economy Behind the Rate Hike
Let’s examine the recent interest rate hike in the context of the broader economy. Although the war with Iran has caused higher energy prices, the job market remains rather robust, inflation expectation measures have stayed relatively stable, and the U.S. economy remains strong and continues to exhibit growth. As many consider the rise in energy prices and tariffs to be more transitory than structural, we suspect the Fed’s move signals a view on the strength of the underlying economy.
We submit that the preference investors have generally had for stocks over bonds in 2026 also reflects a view that the economic backdrop remains rather healthy. Stocks have handsomely outperformed bonds this year.
U.S. Real GDP Q/Q % A.R.
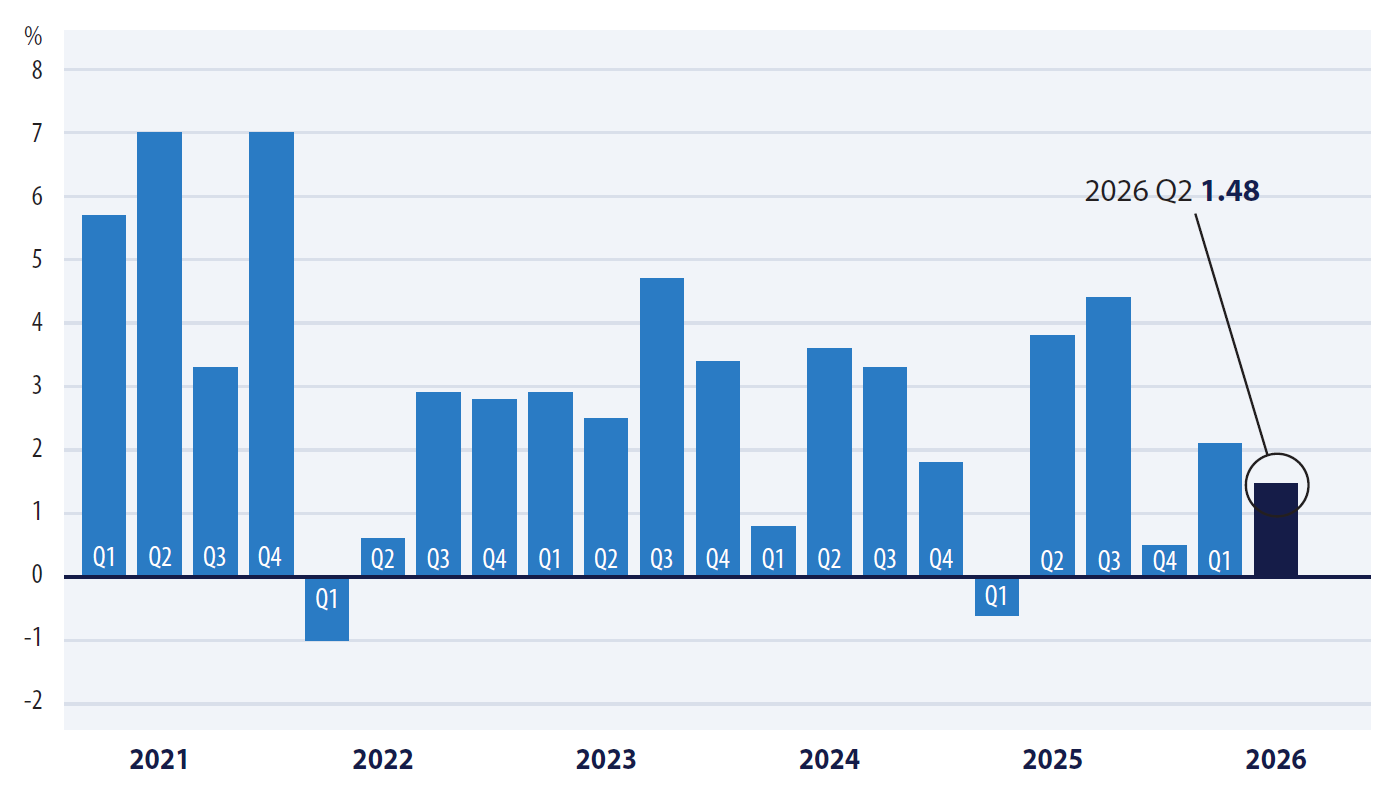
■U.S. Gross Domestic Product, Chained, AR, USD [a.r. 1 quarter]
Source: BairdStrategas/BEA/Macrobond
Please refer to important disclosures at the end of this presentation.
What History Tells Us About Market Performance During Rising Rates
Let’s review the data from the last eight hiking cycles to compare the relative performance of bonds, stocks and the U.S. 10-Year Treasury. For simple analysis, we reviewed the annual returns of these asset classes at the end of the calendar year following the initial announcement of the rate hike. The following chart is quite illuminating:
| Date of Hike | BB U.S. Aggregate Bond | US 10 Year | S&P | |
|---|---|---|---|---|
| 3/31/83 | 8.36% | 3.20% | 22.56% | |
| 1/5/87 | 2.75% | -4.96% | 5.25% | |
| 3/30/88 | 7.89% | 8.22% | 16.54% | |
| 2/4/94 | -2.92% | -8.04% | 1.32% | |
| 6/30/99 | -0.82% | -8.25% | 21.04% | |
| 6/30/04 | 4.34% | 4.49% | 10.88% | |
| 12/16/15 | 0.55% | 1.28% | 1.38% | |
| *No Hike | 12/31/16 | 2.65% | 0.69% | 11.96% |
| 3/16/22 | -13.01% | -17.83% | -18.11% |
*Chart includes returns from 2016 as the 2015 hike occurred in December 2015. Sources: Bloomberg and Pier 88 Research as of 9/22/2026.
Please refer to important disclosures at the end of this presentation.
Equities, as represented by the S&P 500, outperformed bonds, represented by the Bloomberg U.S. Aggregate Bond Index (“Bloomberg U.S. Aggregate”), and the U.S. 10-Year Treasury in 8 of the 9 years following the initial Fed move.
The Convertible Advantage: Equity Participation With a Downside Hedge
Financial literature is replete with theories and opinions as to why bonds tend to underperform stocks when interest rates are rising. We suggest the simple answer has to do with the strength of the underlying economy. The Fed tends to tighten to fight inflation brought about by a strong economy that is expanding. Our research and decades of experience with investment grade convertible bonds inform us that the asset class’s returns are highly correlated with the returns of the underlying stock. Our research team calculates the current sensitivity of the broader investment grade convertible bond universe to their underlying equities to be approximately 53% – meaning that one would traditionally expect for the convertible to enjoy 53% of the upside move in its underlying equity.
This sensitivity (or “Delta”) tends to increase as the stock rises and decrease as the stock declines. Given this current, an appreciating stock market is typically a positive signal for the convertible bonds. On the other hand, the delta also suggests that convertible bonds should offer some downside protection should equity markets fall.
How Convertibles Have Performed in Hiking Cycles
Index information for the two investment grade convertible bond indexes, the ICE BofA Investment Grade U.S. Convertible 5% Constrained Index (VX5C) and the ICE BofA Investment Grade U.S. Convertible Bond Index (VXA1), only goes back to 2012 and 1995, respectively, so we can assess how investment grade convertibles performed in 4 hiking cycles. The data indicates that investment grade convertibles (as represented by the VXA1) outperformed the broader fixed income market (as represented by the Bloomberg U.S. Aggregate) and the U.S. 10-Year Treasury.
| Date of Hike | BB U.S. Aggregate Bond | US 10 Year | VXA1 | |
|---|---|---|---|---|
| 6/30/99 | -0.82% | -8.25% | 13.67% | |
| 6/30/04 | 4.34% | 4.49% | 7.14% | |
| 12/16/15 | 0.55% | 1.28% | 1.68% | |
| *No Hike | 12/31/16 | 2.65% | 0.69% | 14.23% |
| 3/16/22 | -13.01% | -17.83% | -7.74% |
*Chart includes returns from 2016 as the 2015 hike occurred in December 2015. Sources: Bloomberg and Pier 88 Research as of 9/22/2026.
Please refer to important disclosures at the end of this presentation.
The Case for Convertibles Today
Similar to equities, investment grade convertible bonds outperformed the broader fixed income market and the U.S. 10-Year Treasury for those 5 years following the initial rate hike. Let’s examine the sector data below:
Index Performance During Periods of An Increasing Fed Funds Target Rate (Annualized)
| Index | 1/31/1994 – 2/28/1995 | 5/31/1999 – 5/31/2000 | 5/31/2004 – 6/30/2006 | 11/30/2015 – 12/31/2018 | Average (Sorted) |
|---|---|---|---|---|---|
| Technology | 20.0% | 47.5% | 0.0% | 15.0% | 20.6% |
| Real Estate | NA | NA | 20.4% | 3.6% | 12.0% |
| Energy | 4.4% | 11.8% | 33.6% | -2.3% | 11.9% |
| Health Care | 20.3% | 9.2% | 0.8% | 8.5% | 9.7% |
| Utilities | -3.9% | 5.1% | 20.9% | 11.2% | 8.3% |
| S&P 500 | 4.1% | 10.5% | 8.1% | 8.4% | 7.8% |
| Industrials | 0.6% | 10.9% | 12.4% | 6.7% | 7.7% |
| Financials | 2.6% | 1.7% | 8.9% | 8.2% | 5.3% |
| Discretionary | -6.4% | 3.8% | 3.9% | 8.3% | 2.4% |
| Materials | 0.5% | -11.6% | 14.1% | 5.6% | 2.1% |
| Staples | 13.8% | -15.1% | 5.1% | 4.0% | 1.9% |
| Communications | -3.1% | -9.3% | 12.5% | 2.7% | 0.7% |
*Source: Strategas Research as of 9/22/2026
Please refer to important disclosures at the end of this presentation.
Technology and Healthcare are two of the sectors that have outperformed the average sector during periods of increasing Fed Funds Target Rate. Pier 88 has a strong track record of investing in these two sectors, and has been overweight these sectors given the strong secular trends and business fundamentals of our portfolio companies.
We believe, especially given the current environment, that convertible bonds can have a meaningful place in any investment portfolio seeking diversification benefits and outperformance relative to the traditional bond market.
Disclosures
This newsletter is a proprietary publication and the property of Pier 88 Investment Partners, LLC (“Pier 88”). The publication is written to express our view of the market and to explain our investment philosophy. Securities of Pier 88 (the “Fund”) are offered to selected investors only by means of a complete offering memorandum and related subscription materials. It is not intended to provide specific investment advice or to guarantee that any past performance will be indicative of future performance results. An investment in any strategy, including the strategy described herein, involves a high degree of risk. Certain statements contained in this newsletter (such as those that contain words like “may,” “will,” should,” “expect,” “anticipate,” “project,” “estimate,” “intend,” “continue,” or “believe”) are “forward-looking” insofar as they attempt to describe beliefs or future events. No representation or warranty is made as to future performance or such forward-looking statements. Any reproduction or other unauthorized use is strictly prohibited. All information contained in the newsletter was obtained from sources deemed qualified and reliable; however, Pier 88 makes no representation or warranty as to the accuracy of the information contained herein. All expressions of opinion are subject to change without notice in reaction to shifting market conditions.
The graphs, charts and other visual aids are provided for informational purposes only. None of these graphs, charts or visual aids can of themselves be used to make investment decisions. No representation is made that these will assist any person in making investment decisions and no graph, chart or other visual aid can capture all factors and variables required in making such decisions.
No representation is being made that any investor or portfolio will or is likely to achieve profits or losses similar to those shown. References to market or composite indices, benchmarks, or other measures of relative market performance over a specified period of time are provided for information only. Reference or comparison to an index does not imply that the portfolio will be constructed in the same way as the index or achieve returns, volatility, or other results similar to the index. Indices are unmanaged, include the reinvestment of dividends and do not reflect transaction costs or any performance fees. Unlike indices, the Fund will be actively managed and may include substantially fewer and different securities than those comprising each index.
S&P 500 Index (SPX): The S&P 500 focuses on the large-cap sector of the market; however, since it includes a significant portion of the total value of the market, it also represents the market. Companies in the S&P 500 are considered leading companies in leading industries.
Bloomberg U.S. Aggregate Bond Index (Bloomberg U.S. Aggregate)*: The Bloomberg U.S. Aggregate Bond Index measures the performance of the U.S. dollar-denominated, investment-grade, fixed-rate taxable bond market. It is used in this material as a broad measure of U.S. investment-grade fixed-income performance during the referenced Federal Reserve rate-hiking cycles.
U.S. Generic Government 10-Year Treasury (USGG10YR)*: USGG10YR is a Bloomberg reference series reflecting the market yield of a U.S. Treasury security with approximately ten years to maturity. It is used in this material as a point of comparison to illustrate historical U.S. Treasury market performance during the referenced Federal Reserve rate-hiking cycles. References to U.S. 10-Year Treasury performance are based on data obtained from Bloomberg as of the dates indicated.
ICE BofA Investment Grade U.S. Convertible Indices (VXA1 and VX5C): The ICE BofA Investment Grade U.S. Convertible Index (“VXA1”) is a market-capitalization-weighted index of U.S. corporate convertible securities that meet the index provider’s investment-grade and eligibility criteria. The ICE BofA Investment Grade U.S. Convertible 5% Constrained Index (“VX5C”) measures investment-grade U.S. convertible securities and applies a 5% issuer-level constraint intended to reduce concentration in any single issuer. VXA1 and VX5C are used in this material to illustrate the historical performance of the investment-grade U.S. convertible market during the referenced Federal Reserve rate-hiking cycles. Because VX5C history is available only from 2012 and VXA1 history is available from 1995, the index shown varies depending on the period presented. Accordingly, results across periods may reflect differences in index composition and methodology and are not directly comparable in all respects.
The holdings identified do not represent all of the securities purchased, sold, or recommended for Pier 88’s clients. It should not be assumed that investments made in the future will be profitable or will equal the performance of the securities in this list. Additional information, including (i) the calculation methodology; and (ii) a list showing the contribution of each holding to the account’s performance during the period will be provided upon request. Past performance is not indicative of future results.
These materials are not intended to constitute investment advice or a recommendation within the meaning of the Employee Retirement Income Security Act of 1974, as amended (“ERISA”), Section 4975 of the Internal Revenue Code of 1986, as amended (the “Code”), or the Department of Labor regulations at 29 CFR 2510.3-21. If you are, or are using any assets of, or are acting on behalf of, an employee benefit plan subject to ERISA or a plan or account subject to Section 4975 of the Code (including, without limitation, an individual retirement account) (any of such entities, a “Plan”), you will be required prior to any new or additional investment in one of our funds or accounts to represent and warrant that: (i) the person or entity making the investment decision on behalf of the such Plan (the “Plan Fiduciary”) is independent of us and constitutes an independent fiduciary with financial expertise within the meaning of 29 CFR 2510.3-21; (ii) the Plan Fiduciary is capable of evaluating investment risks independently, both in general and with regard to particular transactions and strategies; (iii) the Plan Fiduciary is a fiduciary under ERISA, the Code, and 29 CFR 2510.3-21with respect to the investment in such fund or account and is responsible for exercising independent judgment in evaluating such transaction; and (iv) no fee or other compensation is being paid directly to us or to any of our affiliates in connection with such transaction. The Plan Fiduciary also will be required to acknowledge that we are not undertaking to provide impartial investment advice, or to give advice in a fiduciary capacity, in connection with the investment in any such fund or account, and that we have financial interests in the operation of such funds and accounts, which will be described in constituent documents of the funds and accounts.
DM#544
Convertible securities are hybrid securities that have characteristics of both bonds and common stocks and are therefore subject to fixed income security risks and conversion value-related equity risk. Convertible securities are similar to other fixed-income securities because they usually pay a fixed interest rate and are obligated to repay principal on a given date in the future. The market value of fixed-income securities tends to decline as interest rates increase. Convertible securities are particularly sensitive to changes in interest rates when their conversion to equity feature is small relative to the interest and principal value of the bond. Convertible issuers may not be able to make principal and interest payments on the bond as they become due. Convertible securities may also be subject to prepayment or redemption risk. If a convertible security is called for redemption, the Fund will be required to surrender the security for redemption and convert it into the issuing company’s common stock or cash at a time that may be unfavorable to the Fund. Convertible securities may have characteristics similar to common stocks, especially when their conversion value is greater than the interest and principal value of the bond. When a convertible security’s value is more closely tied to its conversion to stock feature, it is sensitive to the underlying stock’s price.
* Source: Bloomberg Index Services Limited. BLOOMBERG® and the indices referenced herein (the “Indices”, and each such index, an “Index”) are service marks of Bloomberg Finance L.P. and its affiliates (collectively, “Bloomberg”) and/or one or more third-party providers (each such provider, a “Third-Party Provider,”) and have been licensed for use for certain purposes. To the extent a Third-Party Provider contributes intellectual property in connection with the Index, such third-party products, company names and logos are trademarks or service marks, and remain the property, of such Third-Party Provider. Bloomberg or Bloomberg’s licensors own all proprietary rights in the Bloomberg Indices. Neither Bloomberg nor Bloomberg’s licensors, including a Third-Party Provider, approves or endorses this material, or guarantees the accuracy or completeness of any information herein, or makes any warranty, express or implied, as to the results to be obtained therefrom and, to the maximum extent allowed by law, neither Bloomberg nor Bloomberg’s licensors, including a Third-Party Provider, shall have any liability or responsibility for injury or damages arising in connection therewith.

