Stability in Chaos: The Market Moves Forward Despite Global Tensions
Explore Catalyst Funds | Explore Rational Funds
The Macro View: Volatility, Tariffs, and Fed Jitters
By David Miller, Co-Founder and Chief Investment Officer, Catalyst Capital Advisors LLC and Rational Advisors, Inc.
As we begin Q3 2025, the investing landscape continues to be shaped by three dominant macro forces: persistent trade tensions, evolving interest rate policy, and slowing global growth expectations.
Markets entered July still recovering from the tariff-driven dislocation that rattled Q2. While the worst fears of an all-out global trade war have not materialized, tariff escalation with China, Canada, and Mexico remains a live risk. Investors are weighing the paradoxical potential for a “tariff recession” to catalyze Fed rate cuts—an echo of what we saw in 2020. In fact, markets now price in two 25 bps cuts by year-end, even as inflationary impulses remain stickier than expected due to supply chain shocks and deficit spending.
Key Signals to Watch in Q3:
- Federal Reserve Policy: After holding steady in Q2, markets expect clearer dovish signaling at the upcoming August Jackson Hole symposium and the September FOMC meeting.
- GDP Trajectory: Q1 GDP showed a deceleration. It is an open-ended question as to the direction of the trajectory going forward, but the new bill will likely be a stimulus.
- Consumer Confidence: Still fragile after a sharp Q2 drop, this remains a key sentiment barometer.
- Yield Curve Dynamics: The 2s/10s curve remains relatively flat in slope.
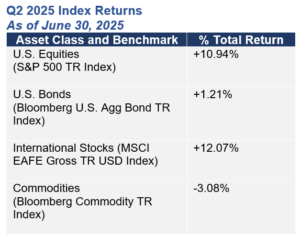
Source: Bloomberg & YCharts. From 3/31/25 to 6/30/25.
Mr. Miller is a portfolio manager for the Catalyst Systematic Alpha Fund (ATRFX), Catalyst Insider Buying Fund (INSIX), Catalyst Insider Income Fund (IIXIX), Rational Strategic Allocation Fund (RHSIX) and the Strategy Shares Gold Enhanced Yield ETF (GOLY).
Equity Markets: A Q2 Comeback, but Volatility Remains the Name of the Game
By Michael Dzialo, Karen Culver, Peter Swan, Zachary Fellows, John Dalton, and Nicolas Vilotti of the Managed Asset Portfolios Investment Team.
Investors would not know it from the slight gains in the broader market so far this year, but volatility has been the defining term for the first half of 2025. In fact, a recent Barron’s article mentioned that, on a risk-adjusted basis, returns for the S&P 500 this year have been in the 24th percentile since 1990, while volatility has been in the 89th percentile. Now, more so than ever, the broader markets react to headlines and tweets rather than facts and figures.
U.S. stocks fell in the first quarter after two consecutive years of gains amid rising policy uncertainty in Washington, marking the worst relative performance for U.S. stocks versus global markets in 23 years. Fast forward to the second quarter, and U.S. stocks rebounded following Liberation Day lows as global stocks treaded water. As we move into the third quarter, the same uncertainties that plagued the U.S. market in the first half of the year remain, including valuations, global macroeconomic activity, interest rates, and tariffs.
Despite the volatility this year, the S&P 500 is trading at 25.8 times trailing earnings, above the 5 and 10-year averages of 23.87 and 21.68, respectively. This compares to the MSCI ACWI ex-USA, trading at 15.92 times trailing earnings, slightly below the 5 and 10-year averages of 16.42 and 16.26, respectively. U.S. stocks have historically commanded premium valuations over most other countries for several reasons; however, we believe the delta between the two is too wide. Elevated valuations need the support of continued earnings growth. Companies reported decent earnings growth in the first quarter, yet many either pulled guidance for the rest of the year or issued softened guidance in the face of economic uncertainty.
Assessing the Health of the U.S. Economy
The U.S. economy has demonstrated remarkable resilience in 2025, but cracks are beginning to form. Our investment team is closely watching the labor market as layoffs rise, and recent college graduates are having difficulty finding a job. As such, we have a cautious view on the U.S. economy. At its most recent meeting, the Federal Reserve (the “Fed”) lowered its 2025 GDP forecast to 1.4% from 1.7% while raising its forecast for core inflation to 3.1% from 2.8% in anticipation of a tick up in inflation in the coming months stemming from tariffs. Eventually, we believe the Fed will succumb to political pressure and, as the economy slows, lower interest rates, further steepening the yield curve. Either way, Fed Chair Jerome Powell’s term ends in May 2026, and whoever President Trump selects to succeed him will likely share his views that the Fed needs to lower rates.
While U.S. investors grapple with uncertainty, markets outside the U.S. appear well-positioned over the long-term. We believe that U.S. trade policies should become catalysts to push foreign nations to spend more on infrastructure and defense. As we have witnessed in the U.S. over the past several decades, spending money is stimulative to the economy. We believe Europe may be in the preliminary stages of a substantial economic rebound as spending increases.
Why Investors Should Consider a Global, Active Approach
Overall, we believe an environment of heightened geopolitical and economic uncertainty strengthens the case for active management. While we monitor, we do not act on the seemingly daily barrage of tweets and headlines coming out of Washington. Rather, we look at the bigger picture. The investment team believes the U.S. dollar will trend lower over the next few years, not necessarily in a straight line, benefiting global equities as well as select commodities. We are also overweight those sectors that historically do not rely on strong economic growth, including the Consumer Staples, Health Care, and Utilities sectors.
Managed Asset Portfolios sub-advises the Catalyst/MAP Global Equity Fund (CAXIX) and the Catalyst/MAP Global Balanced Fund (TRXIX).
Fixed Income Outlook: Bond Markets & Murphy’s Law
By Michael Perini, Perini Capital LLC.
Murphy’s Law stating “what can go wrong will go wrong” seems like an apt description of life for fixed income investors since the beginning of 2022. Since then, investors in the asset class have had to grapple with the following:
- Multi trillion dollar increases in the Federal Reserve’s balance sheet.
- Fiscal stimulus and budget deficits that are more in line with wartime or deep recessions.
- Inflation that has not been seen since the 1970’s.
- An increase in the Federal Funds rate from 0.25% to 5.50%.
- Tariffs and the uncertainty associated with them.
- Decreased demand for U.S. Treasuries.
- Renewed conflict in the Middle East.
- The “Big Beautiful Bill”
However, perhaps the problems are not what they seem when viewed through a different lens. Maybe what fixed income investors need is a paradigm shift. While all the above-mentioned headwinds make it seem like it may be time to reduce exposure to fixed income, we disagree because of our non-traditional way of viewing the risks associated with fixed income.
In our view, there are three distinct risks to fixed income investors:
- Interest Rate Risk: The risk that interest rates rise.
- Reinvestment Risk: The risk that interest rates fall.
- Credit Risk: The risk of permanent impairment of capital due to defaults.
The events beginning in 2022 and continuing through today have been extremely painful from the standpoint of investors with significant interest rate risk. Interest rates have gone up (a lot!) and prices have gone down. From the standpoint of reinvestment risk, the interest rate environment since 2022 has been a big positive, as the reinvestment rate of incoming cash flows is much higher than it was prior to 2022. The reinvestment component of total return is often underappreciated, both as a counterweight to interest rate risk and as a key in creating return stability to a variety of forward interest rate scenarios. However, achieving this balance is not easy, nor is it often accessible via traditional fixed income solutions.
Traditional fixed income solutions, such as U.S. Treasuries, corporate bonds and municipal bonds, pay interest every six months and principal as a final payment at maturity; therefore, due to the lack of cash flow between issuance and maturity, the reinvestment rate of incoming cash flows is typically not a meaningful component of total return. In contrast, structured credit sectors, such as mortgage-backed-securities, often pay interest and principal every month, and because of this feature the reinvestment of incoming cash flows is generally a meaningful component of total return. Additionally, the higher the cash flow of a portfolio the lower price changes (because of changing rates) matter as a percentage of total return.
Given the uncertainty in today’s macro environment where interest rate volatility and direction will likely remain high and difficult to forecast, we believe investors should look to alternative fixed income solutions that can provide non-correlated returns, diversification and balance interest rate risk versus reinvestment risk. The paradigm shift mentioned herein has the potential to benefit investors when navigating the fixed income markets through the rest of 2025 and beyond.
Perini Capital LLC is the sub-advisor to the Catalyst/Perini Strategic Income Fund (CSIOX)
Spotlight: Why Gold Continues to Shine
By David Miller, Co-Founder and Chief Investment Officer, Catalyst Capital Advisors LLC and Rational Advisors, Inc.
Gold remains a standout asset class as we enter Q3—offering both a potential hedge against geopolitical chaos and an escape from fiat currency erosion. A few key reasons:
- Central Bank Demand Surging: BRICS nations—particularly China and India—are accelerating gold reserves accumulation as part of broader de-dollarization strategies.
- Deficits + Tariffs = Inflation Risk: Persistent U.S. fiscal deficits, now exacerbated by tariff-induced price pressures, add to the long-term inflation argument—which is generally supportive of gold prices.
- Yield Convergence: With bond yields declining and real rates pressured by inflation, the opportunity cost of holding gold is falling—reviving investor interest in gold ETFs and alternatives.
- Technical Breakout: Gold has held above $3,250/oz for much of June and shows signs of an upward breakout as volatility returns to equity markets.
Positioning Implications:
We believe that the current macro environment justifies a meaningful allocation to gold and gold-related strategies.
Looking ahead, the combination of fragile equity sentiment, uncertain policy direction, and structural macro headwinds reinforces our view: gold isn’t just a crisis hedge—it’s becoming a core asset class in the modern portfolio playbook.
IMPORTANT DISCLOSURES
Past performance is not a guarantee of future results.
INVESTORS SHOULD CAREFULLY CONSIDER THE INVESTMENT OBJECTIVES, RISKS, CHARGES AND EXPENSES OF LIQUID ALTERNATIVE FUNDS, INCLUDING THE CATALYST FUNDS AND THE RATIONAL FUNDS. THIS AND OTHER IMPORTANT INFORMATION ABOUT A FUND IS CONTAINED IN THE PROSPECTUS, WHICH CAN BE OBTAINED BY CALLING 866-447-4228 OR AT WWW.CATALYSTMF.COM OR WWW.RATIONALMF.COM, AS APPLICABLE. THE RELEVANT PROSPECTUS SHOULD BE READ CAREFULLY BEFORE INVESTING. BOTH THE CATALYST FUNDS AND THE RATIONAL FUNDS ARE DISTRIBUTED BY NORTHERN LIGHTS DISTRIBUTORS, LLC (“NLD”). NLD HAS HAD NO ROLE IN THE STRUCTURING OR DISTRIBUTION OF ANY OTHER INVESTMENT PRODUCTS REFERENCED HEREIN, AND IS NOT RESPONSIBLE FOR THE MARKETING OR PROMOTIONAL MATERIAL RELATED TO THE OTHER INVESTMENT PRODUCTS PRODUCED OR SPONSORED BY ANY OTHER FIRM. DAVID MILLER, STRATEGY SHARES, MICHAEL DZIALO, KAREN CULVER, PETER SWAN, ZACHARY FELLOWS, JOHN DALTON, NICOLAS VILOTTI, MANAGED ASSET PORTFOLIOS, MICHAEL PERINI, AND PERINI CAPITAL LLC ARE NOT AFFILIATED WITH NLD.
Risk Considerations
Though the objectives, strategies and assets traded may differ significantly across liquid alternative approaches, investing in liquid alternatives generally carries certain risks. These risks may include, but are not necessarily limited to, the following: Certain funds may invest a percentage of their assets in derivatives, such as futures and options contracts. The use of such derivatives and the resulting high portfolio turn-over may expose such funds to additional risks that they would not be subject to if they invested directly in the securities and commodities underlying those derivatives. These funds may experience losses that exceed those experienced by funds that do not use futures contracts, options and hedging strategies. Investing in commodities markets may subject a fund to greater volatility than investments in traditional securities. Currency trading risks include market risk, credit risk and country risk. Foreign investing involves risks not typically associated with U.S. investments. Changes in interest rates and the liquidity of certain investments could affect a fund’s overall performance. Other risks include U.S. Government securities risks and investments in fixed income securities. Typically, a rise in interest rates causes a decline in the value of fixed income securities or derivatives owned by a fund. Furthermore, the use of leverage can magnify the potential for gain or loss and amplify the effects of market volatility on a fund’s share price. All funds are subject to regulatory change and tax risks; changes to current rules could increase costs associated with an investment in a fund.
The value of a fund may decrease in response to the activities and financial prospects of an individual security or group of securities held in a fund’s portfolio. Investments in foreign securities could subject a Fund to greater risks, including currency fluctuation, economic conditions, and different governmental and accounting standards. A fund’s portfolio may be focused on a limited number of industries, asset classes, countries or issuers. Certain funds may invest in high yield or junk bonds, which present a greater risk than bonds of higher quality. Other risks may include credit risks and interest rate risk, particularly with respect to floating rate loan funds. Changes in short-term market interest rates will directly affect the yield on the shares of a fund whose investments are normally invested in floating rate debt. Floating rate loan funds tend to be illiquid, and a fund might be unable to sell the loan in a timely manner as the secondary market is generally a private, unregulated inter-dealer or inter-bank re-sale market.
Any or all of the foregoing risk factors may affect the value of your investment.
The views expressed herein are as of June 30, 2025, and represent a general guide to the perspectives of the authors. The information and opinions contained in this document have been compiled or arrived at based on sources believed to be reliable and in good faith; however, no representations or warranties of any kind are intended or should be inferred with respect to the accuracy of the information contained herein or the economic return of an investment in a fund, and no assurance can be given that existing laws will not be changed or interpreted adversely. All such information and opinions are subject to change without notice.
Some of the statements in this presentation may contain or be based on forward looking statements, estimates, targets or prognoses (collectively, “forward looking statements”), which reflect the advisor’s current view of future events, economic developments and financial performance. Such forward looking statements are typically indicated by the use of words which express an estimate, expectation, belief, target or forecast. Such forward looking statements are based on an assessment of historical economic data, on the experience and current plans of the advisor and/or certain of its advisors, and on the indicated sources. These forward looking statements contain no representation or warranty of whatever kind that such future events will occur or that they will occur as described herein, or that such results will be achieved by any fund or the investments of any fund, as the occurrence of these events and the results of a fund are subject to various risks and uncertainties. The actual portfolio, and thus results, of a fund may differ substantially from those assumed in the forward looking statements. The opinions expressed reflect the advisor’s best judgment at the time this presentation was issued, and the advisorr and its affiliates will not undertake to update or review the forward looking statements contained in this presentation, whether as a result of new information or any future event or otherwise.
The advisor’s judgments about the growth, value or potential appreciation of an investment may prove to be incorrect or fail to have the intended results, which could adversely impact a Fund’s performance and cause it to underperform relative to other funds with similar investment goals or relative to its benchmark, or not to achieve its investment goal.
There is no assurance that these opinions or forecasts will come to pass, and past performance is no assurance of future results.
There is a risk that issuers and counterparties will not make payments on securities and other investments.
Glossary:
Bloomberg Commodity TR Index – designed to be a highly liquid and diversified benchmark for commodity investments.
Bloomberg US Aggregate Bond TR Index – A market capitalization-weighted index that is designed to measure the performance of the U.S. investment grade bond market with maturities of more than one year.
BRICS – an intergovernmental organization comprised of ten countries: Brazil, Russia, India, China, South Africa, Egypt, Ethiopia, Indonesia, Iran and the United Arab Emirates.
Commodities – a basic good used in commerce that is interchangeable with other commodities of the same type. Investors and traders can buy and sell commodities directly in the spot (cash) market or via derivatives such as futures and options.
Credit Spreads – The difference in yield (return) between two debt instruments of the same maturity but with different credit ratings, reflecting the additional risk investors take on when lending to a borrower with a lower credit rating.
Currencies – money in the form of paper and coins that’s used as a medium of exchange. Currencies are created and distributed by individual countries around the world.
MSCI EAFE Gross TR USD Index – a broad market equity index that tracks the performance of large and mid-cap companies in 21 developed markets around the world, excluding the US and Canada.
S&P 500 TR Index – A market capitalization-weighted index that is used to represent the U.S. large-cap stock market.
20250702-4633644
Click here to read the full report.
The Guide to Building a Risk Balanced Portfolio for Volatile Markets
Explore Catalyst Funds | Explore Rational Funds
Most investors intuitively understand the benefits of diversification, but due to a lack of familiarity and perceived complexity with other asset classes, many rely solely on stocks and bonds. As we’ve seen during recent market downturns, these two asset classes don’t always move independently, potentially undermining their ability to provide truly diversified returns.
In our recent report The Guide to Building a Risk Balanced Portfolio for Volatile Markets, we:
-
Introduce the liquid alternatives landscape
-
Explain how allocations to alts could have prevented downturns in past markets for some investors
-
Help investors understand how to diversify their portfolio using data-driven, time-tested approaches.
How Adding a Balanced Risk Strategy (Alternatives) Can Enhance a Portfolio
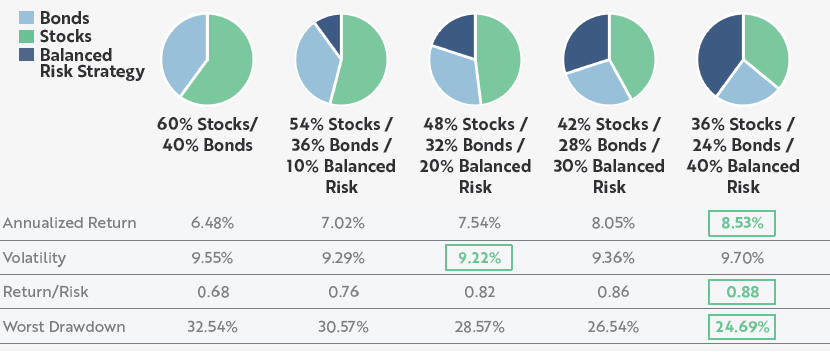 Data Source: Bloomberg LP and Catalyst Capital Advisors LLC. Based on monthly return data from 12/31/1999 to 12/31/2024. Stocks are represented by the S&P 500 TR Index; bonds are represented by the Bloomberg US Aggregate Bond Index; Balanced Risk Strategy is represented by 100% notional exposure to SG CTA Trend Index, 50% allocation to the S&P 500 and a 50% allocation to the Bloomberg US Short Treasury TR Index (to represent collateral for futures program). Rebalanced monthly. Past performance does not guarantee future results. See important disclosures at the end of this presentation, including with respect to the limitations inherent to hypothetical performance comparisons.
Click here to read the full report.
The Market Turns to Tariffs: How Investors Can Navigate a Brave New World
The Market Turns to Tariffs: How Investors Can Navigate a Brave New World
Q2 2025 Market Outlook
Commentary as of April 7, 2025
The Macro View: Tariffs, Interest Rates, and Where Investors Can Look Next
By David Miller, Co-Founder and Chief Investment Officer, Catalyst Funds and Rational Funds. Mr. Miller is a portfolio manager on the Catalyst Systematic Alpha Fund (ATRFX), Catalyst Insider Buying Fund (INSIX), Catalyst Insider Income Fund (IIXIX), Rational Strategic Allocation Fund (RHSIX) and the Strategy Shares Gold Enhanced Yield ETF (GOLY).
The state of markets as we enter Q2 2025 continues to be largely driven by geopolitical concerns and changing U.S. policy on tariffs. The bullish news is that the tariffs are largely now priced into the market and there is the potential for a V-shaped recovery if they are to be removed. There is also the possibility that the tariffs will lead to a full-on trade war. However, if the tariffs lead to a trade war, there is a high probability that this development will drive interest rates substantially lower which, in aggregate, could be net neutral for equities.
The key issues to watch going forward are interest rate policy at the Fed, any new tariff developments, consumer confidence numbers, and the delta of gross domestic product (GDP) growth. The combination of these factors is the primary impetus for moves in markets in the near term.
An interesting contrarian view to take note of is that lower interest rates driven by tariffs could actually be more important than GDP growth. For example, in 2020, GDP dropped precipitously as did interest rates. Even though Q1 2020 was a severe contraction, the stock market finished the year substantially higher.
When scanning the market for potential opportunities, we believe in gold for investors right now as a combination of federal government deficits and tariffs are driving inflation, which is good for a gold rally. Additionally, a large central bank gold buying program by the BRICS (Brazil, Russia, India, China and South Africa) nations is creating a positive feedback loop for gold investors.

Equity Market Turmoil & Outlook: What Should Advisors Do Now?
By Dr. Patrick Welton and Dr. François Chevallier-Gravezat, PhD, Welton Investment Partners. Welton Investment Partners sub-advises the Catalyst/Welton Advantage Multi-Strategy Fund (CWEIX).
Q1: From Rally to Reality Check
Optimism Opens the Year
2025 began with the S&P 500 hitting record highs, small caps rebounded, and breadth improved. Q4 earnings surpassed expectations (77% of S&P 500 companies beat earnings per share (EPS) estimates), and year-over-year growth reached 15.1% – the strongest in three years.
Cracks Beneath the Surface
However, beneath the surface, cracks began to appear. China’s AI advances triggered a sharp selloff in U.S. tech stocks, unsettling the AI-led growth narrative. Inflation surprised on the upside, while employment and retail data softened. Consumer confidence experienced its sharpest decline since 2021. Meanwhile, the Fed held rates steady by postponing rate cuts, as tariff threats from Washington against China, Mexico, and Canada reignited fears of a global trade reversal. Given this rapidly evolving landscape, markets increasingly reacted to macro instability rather than corporate fundamentals.
From Rotation to Reversal
By March, equities transitioned from rotation to reversal. Growth stocks faltered while value stocks took the lead. Inflation data fluctuated, the dollar weakened sharply, gold reached highs, and consumer sentiment continued its downward slide. The Fed maintained interest rates but revised its economic outlook. By month-end, March lost -5.6% to become the worst month for the S&P 500 since 2022, including a -10% peak-to-trough correction between February 19 and March 13.
Looking Ahead
Transition in Progress
Markets are at a turning point. We believe the era of synchronized global growth and cooperation is transitioning into fragmentation, trade tensions, and divergent policy directions. The calm post-pandemic period has given way to renewed macro complexity.
We Saw This Coming – But Not This Quickly
Our January 2025 paper, Advisors’ Guide to the 2025 Stock Market: Optimism Now, Challenges Ahead, highlighted the risks of elevated valuations, policy uncertainty, and increased volatility. Yet this anticipated transition is unfolding faster than expected. Investor anxiety, trade friction, and tighter financial conditions are already reshaping markets dramatically.
Investors on High Alert
Volatility surged in Q1, with the CBOE Volatility Index (VIX) rising from below 15 to nearly 28, ending the quarter around 22. Markets anxiously anticipate a potential global trade war as tariff brinkmanship intensifies. In our opinion, equity investors must differentiate clearly between sectors and companies likely to benefit or suffer from evolving trade policies. Dispersion has become a central challenge in navigating equity markets. Upcoming Federal Reserve meetings in early May and mid-June will keep investors vigilant.
Advisors Must Lead the Shift
Given narrowing market leadership and mounting structural pressures, passive investment strategies may prove insufficient. Concentration, valuation, and volatility risks remain starkly elevated by historical measures. It is our view that this environment calls for active, risk-managed equity strategies designed to participate in upside gains while limiting downside risks and mitigating volatility. Diversification should extend beyond equities, emphasizing uncorrelated return sources such as global macro strategies capable of capitalizing on asset-class dislocations and global economic shifts.
Positioning Within Our Portfolios
The Catalyst/Welton Advantage Multi-Strategy Fund (CWEIX) is positioning for the current environment as follows:
- Risk-managed equity sleeve targeting controlled volatility.
- Systematic global macro approach seeking highly diversifying returns from actively trading commodities, currencies, fixed income, and global equity indices.
- A unified portfolio engineered for adaptability and resilience.
In markets where clarity may remain elusive, proactive and real diversification is, in our view, essential for better long-term client outcomes.
Fixed Income Outlook: Tariffs Unleashed
By Natalia Lojevsky, CIFC Asset Management. CIFC Asset Management is the sub-advisor to the Catalyst/CIFC Senior Secured Income Fund (CFRIX).
After an already turbulent start to the new year and a new Trump presidency, which quickly defied all investor expectations and sent financial markets and investor confidence plunging, the first week of April brought with it a global economic reordering that upended decades of post-WWII economic architecture and will likely reverberate for decades to come.
The sweeping changes impacting everything from trade, immigration, geopolitics, and longstanding government institutions coming out of Washington D.C. overwhelmed the markets, introducing unprecedented uncertainty. The breadth and speed of change, both domestically and geopolitically, stunned the world, as did the initial opening salvos of a trade war which were aimed not just at China this time, but also our closest regional trade partners, Canada and Mexico. And it was not just tariffs dominating the headlines.
Credit spreads, which had so far resisted most of the recession / stagflation narrative building up in equity markets began to show signs of stress. Investment grade spreads widened by 18 basis points (bps) to 114 bps. Much more pronounced weakness was felt in the high yield bond markets, where spreads widened by 100 bps to 457 bps, the most since the regional banking crisis in March 2023. To put that in context, high yield bond spreads are now ~150 bps wider than year-end 2024 and other recent tights. The impact to leveraged loans was lower but spreads also gapped out 45 bps to a 13-month wide of 503 bps. While both high yield bonds and leveraged loans experienced their largest setbacks in recent years, the credit markets remained orderly during the sell-off and were a relative port in the storm experienced by other risk assets. As substantial as these moves have been, credit spreads are still not yet pricing in a recession and are currently back at the averages for the past decade. We believe this can change should the tariff aftershocks persist for an extended time. Elsewhere in fixed income, Treasuries have been faring well, with the 10Y yield dropping by 25 bps, falling below 4% before comments from Chairman Powell that he was concerned about potentially bigger than expected inflationary impacts from the tariffs pushed it off the lows.
There are many questions the markets will have to contend with in the coming quarters as they continue to recalibrate to more U.S. policy shifts and reassess both U.S. and global growth prospects. In our opinion, investors need to be prepared for ongoing volatility on the path forward in the near term, and one where monetary policy may not be as supportive as is currently being priced. Technical pressures may also present a greater challenge than fundamentals as the current period of assessment plays out. While some assets appear affordable, we are continuously reviewing projections to determine appropriate valuations.
From a portfolio perspective, we continue to stick to our discipline in avoiding reactive decisions and advise investors to focus on the same approach. We are equally focused on staying defensive while closely evaluating positions to determine cash flow resiliency and credit fluctuation. We believe our direct exposure to material tariff risk is minimal; however, we are conducting further analysis of potential direct and second-order tariff impacts. Despite the sharp valuation shifts and dynamically evolving macroeconomic landscape, we continue to believe that credit and yielding assets offer better opportunities than many other asset classes today.
Spotlight on Alts: Energy Infrastructure
By Simon Lack, Founder of SL Advisors. SL Advisors sub-advises the Catalyst Energy Infrastructure Fund (MLXIX)
As we enter Q2, we see three powerful legs to the midstream energy story. They are demand growth for natural gas, attractive valuations, and the Trump administration’s support for traditional energy. It’s our belief that there’s too little appreciation of the underlying support from these three elements.
Part of the reason we’re optimistic about this sector is the growth of AI and the related infrastructure that will be needed to meet this demand. Last year the market began to appreciate the likely impact of new data centers on natural gas demand growth. Renewables remain a footnote in terms of actual U.S. power generation. Despite the headlines that are generated from solar and wind production, they account for only 16% of our electricity, while natural gas provides 43%.

We’re enjoying the Natural Gas Energy Transition because growth in production is eight times that of renewables over the past five years, ten years and for the 21st century.
We’re also optimistic on the sector long-term, evidenced in part by the fact that S&P expects data centers to add between 3 billion cubic feet per day (BCF/D) and 6 BCF/D to gas demand by 2030.
It’s not just our own research pointing to this increased demand. Williams Companies expects power demand to grow at ten times the pace of the past decade. Much of this will be supplied by natural gas, but even where intermittent energy plays a role, it’ll require natural gas back-up because data centers don’t only run when the weather co-operates.

Increased LNG exports and pipeline sales to Mexico should add to industrial sector demand.
The demand for US LNG is supported by investments many importing countries have made in regassification facilities that allow them to convert gas from the near-liquid form in which it arrives by tanker back into the gaseous form required by users.
Cheniere notes that global regassification capacity is 2X the expected supply of LNG, which shows that demand is likely to be more than equal to supply over the next several years.
The positive demand story would be unremarkable if it was reflected in high valuations for midstream stocks, but it’s not. The S&P 500 trades at around 25X 2025 Factset EPS. Although valuation isn’t a good timing tool, this is historically not an attractive comparison with bonds.
As we often tell people, there’s no irrational exuberance present in this sector. Valuations and fund flows still exhibit excessive caution in our opinion. Completing the trifecta, we have a new administration that is fully behind U.S. oil and gas production. In his inauguration speech Trump even repeated “drill, baby, drill.”
An de-regulated environment may lower costs for Exploration and Production (E&P) companies, but in our opinion, signs are that increased output will need to be profitable.
Trends show that U.S. energy underpins America’s past decade of strong growth and rising living standards. As Germany has pursued its energy transformation (“Energiewende”), electricity prices have soared and manufacturing has slumped, all while global CO2 emissions have continued rising.
It is for those reasons we are optimistic about the energy infrastructure section moving forward in Q2 and beyond.
Past performance is not a guarantee of future results.
INVESTORS SHOULD CAREFULLY CONSIDER THE INVESTMENT OBJECTIVES, RISKS, CHARGES AND EXPENSES OF THE CATALYST FUNDS. THIS AND OTHER IMPORTANT INFORMATION ABOUT THE FUND IS CONTAINED IN THE PROSPECTUS, WHICH CAN BE OBTAINED BY CALLING 866-447-4228 OR AT WWW.CATALYSTMF.COM AND WWW.RATIONALMF.COM. THE PROSPECTUS SHOULD BE READ CAREFULLY BEFORE INVESTING. NORTHERN LIGHTS DISTRIBUTORS, LLC (“NLD”) IS THE DISTRIBUTOR SOLELY FOR THE CATALYST MUTUAL FUNDS AND RATIONAL MUTUAL FUNDS. NLD HAS HAD NO ROLE IN THE STRUCTURING OR DISTRIBUTION FOR ANY OTHER INVESTMENT PRODUCTS REFERENCED HEREIN, AND IS NOT RESPONSIBLE FOR THE MARKETING OR PROMOTIONAL MATERIAL RELATED TO THE OTHER INVESTMENT PRODUCTS PRODUCED OR SPONSORED BY ANY OTHER FIRM. DAVID MILLER, STRATEGY SHARES, DR. PATRICK WELTON, DR. FRANÇOIS CHEVALLIER-GRAVEZAT, PHD, WELTON INVESTMENT PARTNERS, NATALIA LOJEVSKY, CIFC ASSET MANAGEMENT, SIMON LACK, AND SL ADVISORS ARE NOT AFFILIATED WITH NORTHERN LIGHTS DISTRIBUTORS, LLC.
Risk Considerations
Investing in the Funds mentioned above carries certain risks. The value of the Fund may decrease in response to the activities and financial prospects of an individual security in the Fund’s portfolio. Investments in foreign securities could subject the Fund to greater risks including, currency fluctuation, economic conditions, and different governmental and accounting standards. The Fund’s portfolio may be focused on a limited number of industries, asset classes, countries, or issuers. The Fund may invest in high yield or junk bonds which present a greater risk than bonds of higher quality. Other risks include credit risks and interest rate for Floating Rate Loan Funds. Changes in short-term market interest rates will directly affect the yield on the shares of a fund whose investments are normally invested in floating rate debt. Floating Rate Loan Funds tend to be illiquid, the Fund might be unable to sell the loan in a timely manner as the secondary market is private, unregulated inter-dealer or inter-bank re-sale market. These factors may affect the value of your investment.
The advisor’s judgments about the growth, value or potential appreciation of an investment may prove to be incorrect or fail to have the intended results, which could adversely impact the Fund’s performance and cause it to underperform relative to other funds with similar investment goals or relative to its benchmark, or not to achieve its investment goal.
There is no assurance that these opinions or forecasts will come to pass, and past performance is no assurance of future results.
There is a risk that issuers and counterparties will not make payments on securities and other investments.
Glossary:
Bloomberg Commodity Index – designed to be a highly liquid and diversified benchmark for commodity investments.
Bloomberg US Aggregate Bond Index: A market capitalization-weighted index that is designed to measure the performance of the U.S. investment grade bond market with maturities of more than one year.
Bullish – Optimistic about the future trajectory of financial markets.
Commodities – a basic good used in commerce that is interchangeable with other commodities of the same type. Investors and traders can buy and sell commodities directly in the spot (cash) market or via derivatives such as futures and options.
Consumer Confidence Numbers – Economic indicators that reflects how optimistic consumers are about the economy and their personal finances.
Credit Spreads – The difference in yield (return) between two debt instruments of the same maturity but with different credit ratings, reflecting the additional risk investors take on when lending to a borrower with a lower credit rating.
Currencies – as money in the form of paper and coins that’s used as a medium of exchange. Currencies are created and distributed by individual countries around the world.
Delta of GDP – Refers to the change or difference in Gross Domestic Product
Earnings Per Share – A financial metric that measures a company’s profitability by indicating how much profit is allocated to each outstanding share of common stock. It’s calculated by dividing a company’s net income by the number of outstanding shares.
Equity Sleeve – a portion of a portfolio, often a sub-account within a larger investment account, that is specifically allocated to equity investments.
MSCI EAFE Gross TR USD Index – a broad market equity index that tracks the performance of large and mid-cap companies in 21 developed markets around the world, excluding the US and Canada.
Peak to Trough – The high and low points, or ups and downs, in a sequence or cycle, often used to describe the fluctuations in markets
2025 FactSet EPS – In the context of FactSet, Earnings Per Share (EPS) is a key financial metric indicating a company’s profitability on a per-share basis. It’s calculated by dividing a company’s net income by the total number of outstanding shares. FactSet uses EPS data to analyze and track company performance, estimate value, and provide insights for financial professionals and investors.
S&P 500 TR Index – A market capitalization-weighted index that is used to represent the U.S. large-cap stock market.
20250411-4393882
Market Outlook: Five Questions for Five Managers on What to Expect in 2025
[vc_row][vc_column css=”.vc_custom_1532034303005{background-color: #ffffff !important;}”][vc_row_inner][vc_column_inner][mk_padding_divider size=”150″][mk_fancy_title size=”40″ force_font_size=”true” size_smallscreen=”40″ size_tablet=”30″ size_phone=”30″ font_weight=”bold” txt_transform=”capitalize” margin_bottom=”0″ font_family=”none”]
Market Outlook: Five Questions for Five Managers on What to Expect in 2025
[/mk_fancy_title][vc_column_text css=”.vc_custom_1734365598336{margin-bottom: 0px !important;}”]Inflation, Trump’s Tariffs, The Mag 7, and the Risk and Opportunity Set – How Our Investment Teams View the Road Ahead for 2025[/vc_column_text][vc_column_text css=”.vc_custom_1734365621392{margin-bottom: 0px !important;}”]2025 Outlook | December 2024[/vc_column_text][mk_button dimension=”flat” corner_style=”full_rounded” icon=”mk-icon-cloud-download” url=”https://go.pardot.com/l/497001/2024-12-16/2b6lq4t/497001/1734373452taPDilN3/Five_for_Five_in_2025_Final.pdf” target=”_blank” margin_top=”15″ bg_color=”#2580e8″ btn_hover_bg=”#288bfc”]Download PDF[/mk_button][mk_divider style=”thin_solid” margin_top=”0″][vc_column_text css=”.vc_custom_1734365641944{margin-bottom: 0px !important;}”]At Catalyst Funds and Rational Funds, we partner with investment managers to bring alternative strategies to the retail space. In this piece, we surveyed five of our portfolio managers spanning across multiple asset classes to weigh in on what they see as the emerging threats, trends, and opportunities for investors as we enter 2025.
We hope these insights are helpful to you as you prepare your investment approach for the upcoming year. We would be happy to discuss how our solutions best fit into your portfolio moving forward.
Here is a summary of the managers we spoke with for their outlooks.[/vc_column_text][mk_table]
| Author | Asset Class Specialty | Investment Firm | Catalyst and Rational Product(s) |
| Eric Clark, Portfolio Manager | Equities | Accuvest Global Advisors | Rational Dynamic Brands Fund (HSUTX) |
| David Miller, CIO and Co-Founder/Portfolio Manager | Alternatives, Equities, Fixed Income | Catalyst Funds, Rational Funds, and Strategy Shares | Catalyst Systematic Alpha Fund (ATRFX)
Catalyst Insider Income Fund (IIXIX) |
| Roy Niederhoffer, Founder, President, Portfolio Manager | Equities, Alternatives | R.G. Niederhoffer Capital Management, Inc. | Rational/RGN Hedged Equity Fund (RNEIX) |
| Joe Tigay, Portfolio Manager | Equities, Volatility | Equity Armor Investments, LLC | Rational Equity Armor Fund (HDCTX) |
| Dr. Patrick Welton, Founder and Chief Investment Officer | Equities, Alternatives | Welton Investment Management | Catalyst/Welton Advantage Multi-Strategy Fund (CWEIX) |
[/mk_table][/vc_column_inner][/vc_row_inner][vc_row_inner][vc_column_inner][mk_divider style=”thin_solid”][vc_column_text css=”.vc_custom_1734366018842{margin-bottom: 0px !important;}”]
- What are your expectations for inflation in 2025 and the Fed’s path going forward?
Our managers largely see the worst of inflation as behind us, with some potential risks ahead. Though most of our respondents see a target of between 2%-3%.
“We expect inflation to be sticky from here and even slightly rise in 2025 while not getting out of control like we saw in 2022,” said Eric Clark, Portfolio Manager of the Rational Dynamic Brands Fund. “Largely, we believe rates and inflation will stay higher for longer and be volatile around economic reports.”
He notes that he expects there to be short-term volatility created around these data releases as short-term traders position and react to any moves – and plans to adjust his investment approach as they do so. His Fund generally invests in large names of recognizable brands.
“Our relevant holdings are set using this base case in mind, so we have brands with great balance sheets, pricing power, high brand loyalty and that are offering customers reasons to spend and be loyal,” he said. “The current inflation regime is not generally affecting their businesses or customer loyalty.”
David Miller, Co-Founder, Portfolio Manager, and Chief Investment Officer of Catalyst Funds and Rational Funds, has moderate expectations for inflation, with the belief that it will hover around 3% in the coming year. He notes that given the strength in GDP growth numbers and unemployment, the Federal Reserve may only need one more rate cut.
Patrick Welton, Founder and Chief Investment Officer of Welton Investment Management, has a similar view on inflation.
“We expect inflation drifting between 2 to 3 percent,” he said. “Dislodging it from this range will require policy, economic, or geopolitical changes outside the market’s expectations. The Fed’s path will halt if its prime directives are hit. If either inflation rises above 3% or the unemployment rate begins to trend down, we expect the Fed path halts or turns around. In this setting, our strategy would likely see returns shifting from broad equity sources in 2024 to any or all of selective equity sector/industry moves, short bonds, long inflation trades, and currency trends.”
Joe Tigay of Equity Armor Investments believes the Fed will be “data-dependent, allowing economic conditions to dictate policy decisions.”
“If inflation persists at manageable levels, the Fed will likely allow interest rates to normalize gradually,” he said. “This environment sets the stage for a steepening yield curve, which historically signals rising volatility.”
Finally, Roy Niederhoffer of R.G. Niederhoffer Capital Management, notes that inflation “appears to be under control, despite some recent hints of its return.”
“However, asset valuations are quite high,” she said. “We may be in a situation like the QE years, where consumer prices are stable while equities and other financial assets inflate. This may be due to stimulus via government borrowing, and now potentially lower interest rates.”
In short, the consensus view is that the worst of inflation is behind us, but it’s important to have your guard up.
- Overall, how should investors change their thinking from 2024 given the incoming Trump administration, including any concerns about tariffs, government spending, and potential changes to corporate tax rates?
He’s Time Magazine’s Man of the Year for 2024 and based on our managers viewpoint, President-Elect Donald Trump is likely to be a main character driving markets in 2025 as well, with volatility being the key concern.
“Investors should expect tariffs, minor reductions in government spending, and broad tax policy extensions to be rapidly implemented in Q1 of 2025,” Welton said. “And if they do, they should expect the market to do nothing. These are fully telegraphed, expected, and priced in. Markets will react if expectations are defied.”
But will tariffs be long-term or just something to bring to the negotiating table?
David Miller believes they’ll “likely be used as a negotiating chip to try to extract better trade terms with countries that have tariffs on U.S. products.”
Joe Tigay of Equity Armor believes the Trump administration “will usher in a landscape of winners and losers, making stock selection pivotal in 2025.” He believes that “investors must prepare for periods of uncertainty and tumult.”
“President Trump 2.0 will usher in a historic shift in American political, regulatory, policy and cultural landscape,” according to Niederhoffer. “However, equities face powerful two-way forces that could pull stocks sharply higher or considerably lower. Given the overall bullish tendency in equities, we suggest positioning that maintains upside capture with accommodation for reduced downside risk.”
But along with potential volatility, there comes opportunity.
“Policy changes and geopolitical tensions could create market swings, making long volatility a critical component of a balanced approach,” Tigay said. “Deregulation and potentially lower energy costs could act as boons to the economy, favoring sectors like energy, financials, and industrials… Investors must embrace the dual narrative of growth amid volatility. Staying flexible and focusing on the right sectors—such as energy, industrials, and technology—will be key to capitalizing on the opportunities of 2025.”
Although Eric Clark is also on guard for volatility, he notes that fewer regulations could lead to more opportunities for growth.
“Overall, we think it will be a more business friendly environment with less onerous regulations which should affect business confidence and consumer sentiment positively,” Clark said. “We also think the benefits of AI adoption across corporate America will in time, allow companies to trade at higher average multiples and with higher margins so generally, in a 3–5-year look-back, stocks will not look as expensive then as they do today.”
- The story of the S&P 500 has been primarily about what markets are calling the Mag 7 stocks. Do you think this will continue in 2025 or do you expect other key players to emerge? Is there any concern of concentration risk?
In short, our managers think the Mag 7 will continue to carry the day, but there may be room for more in this “winner and losers” environment.
David Miller: “The Mag 7 stocks are generating significant growth in terms of revenue and earnings power. These companies are massive monopoly businesses with strong fundamental tail winds. I have no reason to believe that the Mag 7 names won’t continue to dominate the S&P in 2025.”
Patrick Welton: “Yes. This is the story of winner’s success combined with automatic passive flows into cap weighted indices. Though there has been rotation over time, concentration risk has accompanied the S&P 500 for decades.”
Roy Niederhoffer: “The concentration of the S&P into a small number of stocks is perhaps a result of a secular shift toward ‘survival of the fittest’ – or (as several astute market analysts have pointed out) it could be merely a symptom of more and more passive rather than active investors. It portends an increase in volatility regardless of the direction of equities.”
Joe Tigay agrees that 2025 will likely follow a similar pattern, but there’s a chance for more than just a Mag 7 driving returns of the S&P 500.
“I expect new players to emerge and join the mix, particularly in sectors like industrials, energy, and financials, which could benefit from a growth-friendly economic environment and deregulation under the Trump administration,” Tigay said. “This evolution underscores the uncertainty inherent in the market, making a strategy of being long the market and long volatility essential.”
Eric Clark believes the market and returns “will continue to broaden out.”
“Overall, we think performance for Mag 7 in 2025 will be more nuanced and selective,” he said. “We like Amazon, Apple, and Meta more than Nvidia, Microsoft, and Google. We do think Microsoft can have a decent year, we like that the stock has been consolidating for a few months, which gives it room for the next push up at some point. Growth and stability should be in high demand for 2025.
But what about concentration risk?
“While the Mag 7 remain vital, their outsized influence raises concentration risk,” Tigay notes. “This highlights the need for diversification and a readiness to capitalize on shifts in leadership. By balancing exposure to these dominant names with opportunities in ascending sectors, investors can navigate both the gains and the inevitable bouts of volatility that will define the market in 2025.”
- What are the biggest risks you see for investors in the coming year in your particular space?
For these next two questions, we’ll let the portfolio managers have the floor, but in short, diversification is their key to fighting potential volatility.
Eric Clark, Equities:
If inflation stays higher for longer, that keeps the Fed on hold versus having more rate cuts so any datapoints that show inflation could be percolating up again could cause knee-jerk selling on a short-term basis. Certainly, much more aggressive tariff implementations could cause a sell-off in certain parts of consumer and retail stocks as well as other industries that could be affected. Another risk is always geopolitics and Trump antagonizing foreign governments causing a trade war. A more contentious relationship with China could be problematic for stocks heavily exposed to China and the consumer there. The biggest risk now could be excess speculation getting more acute at a time when valuations could get stretched. That could cause a market correction within the overall bull market. Wall Street strategists are very bullish about 2025 which could be a contrarian signal as they have been neutral to bearish the last few years expecting a recession that never materialized. When it feels like there’s nothing to worry about, we get worried.
David Miller, General Market Commentary:
The biggest risk for investors in 2025 is that strong growth combined with government deficits will drive interest rates higher and temper the growth in equity valuations.
Roy Niederhoffer, Alternatives/Equities:
Risks include an unexpected bear market that catches investors fully invested with no downside protection, a recurrence of inflation that makes stocks lose real value, potentially even as they rise nominally. Geopolitical and unknown risk factors are ever-present.
A key portfolio risk could be a failure to maintain enough long exposure to keep up with equity markets should they continue to rise. If the rise is caused by asset price inflation/fiat devaluation rather than earnings growth, there could be a significant loss of real value – even as stocks rise. Should fiat devaluation spiral into high inflation, sharply negative real – versus nominal – returns year after year are far more dangerous to portfolios than the risk of a bear market for stocks. We’re not necessarily worried about a Venezuela or Zimbabwe hyperinflationary disaster, but something more moderate that becomes severe over time.
Joe Tigay, Equities/Volatility Trading:
In 2025, the biggest risk for investors in the alternative investment space is failing to maintain the right mix of funds in their alternative basket. With the potential for rising inflation, a steepening yield curve, and increased volatility, having a diversified and strategically balanced alternative portfolio is more critical than ever.
Here are the key risks:
- Overconcentration in One Strategy: Relying too heavily on a single alternative asset class, such as private equity or real estate, could leave investors exposed to sector-specific downturns or liquidity risks.
- Underestimating Volatility: With market uncertainty on the rise, not incorporating volatility-focused strategies—like long vol or tail risk hedging—could erode returns during sharp market swings.
- Neglecting Inflation Protection: Without assets that can hedge against inflation, such as commodities or infrastructure, investors may see their portfolios lose purchasing power.
Patrick Welton, Equities/Alternatives:
One large and portfolio damaging risk would be the simultaneous forces of a second wave of rising inflation and material further expansion of fiscal deficits. The bond markets will be forced to react and catalyze reactions across asset classes everywhere. Though likely a tail wind for our strategy’s performance, it would be bad for the country and likely horrific for 60/40 investors, reviving memories of 2022.
- How would you describe the opportunity set for investors in your area of coverage?
Eric Clark, Equities
Consumer stocks have generally been ignored and flows in the space are almost non-existent as witnessed by ETF AUMs. The consumer and spending beneficiaries are about the least crowded trade in markets and we expect the consumer to stay stable and spending, albeit not spending as broadly as normal. They are looking for bargains and quality so consumers will be getting better deals from retailers and brands because consumers have pushed back on price increases.
We understand consumer behavior and which brands are resonating the most, so we believe our portfolio is well-suited to navigate this continued environment. Overall, there’s a lot of exciting brands with strong EPS growth in 2025 expected and many stocks still have 20%+ price appreciation potential as consumer spending gets back to normal over time. Because the portfolio looks very different than the indexes, we expect more advisors to be interested in the story as the indexes, heavy in tech, become riskier and they seek other diversifiers. Also, because we can play offense and defense, we like having a blend of both in portfolios as the market reaches a short-term ceiling. Having some defensive exposure plus some cash should be a good story in 2025. We should not expect to see such outsized gains as the last two years. We expect the volatility to continue in markets offering the active trading part of the process to help generate alpha as a non-correlating asset class inside the core brands holdings. We expect blending offense and defensive brands will add value over indexes in 2025 and on an absolute basis.
David Miller, General Market Commentary
The equities we own in the Catalyst Insider Buying Fund are benefiting from the current strong economy and are likely to benefit from pro growth policies under a new Trump administration.
Roy Niederhoffer, Alternatives/Equities:
Our strategy seeks to maintain a fully-invested position in large-cap equities, overlaid with a quantitative short-duration futures trading strategy that has tended to outperform in periods of volatility and equity market declines. This overlay can succeed in reducing downside, making it a potentially valuable complement to the long equity holding.
Since our most successful periods have come during the large down years in equities (e.g. 2000, 2008, 2022) the overlay product could be ideally positioned should stocks turn downward without requiring investors to reduce overall long exposure.
Joe Tigay, Equities/Volatility Trading:
The opportunity set for investors in our fund is uniquely compelling as we enter 2025. With a new administration focused on growth and actively cheerleading the market higher, coupled with a Federal Reserve aligned toward pro-growth policies, the environment is ripe for capturing upside potential.
With volatility ending the year at historic lows, we see a rare opportunity for investors to position themselves for success in a pro-growth, low-volatility environment. Here’s why:
- Growth-Focused Strategy: Our fund is built to capitalize on expanding markets, supported by government policies aimed at deregulation and economic stimulation.
- Low Volatility Entry: With the VIX currently near historic lows, now is an ideal time to gain exposure to volatility strategies, which offer significant upside as market uncertainty inevitably returns.
- Multiple Pathways to Success: Our approach delivers in three scenarios:
-
- If stocks rise, we’re positioned to capture market growth.
- If volatility increases, our strategy benefits from its hedging component.
- If both stocks and volatility rise, our fund excels by leveraging both trends simultaneously.
This moment represents a unique entry point for investors seeking to maximize returns in a growth-oriented, low-volatility environment. Our fund is designed to align with the opportunities presented by this pro-growth era, offering a diversified and resilient approach to capitalize on 2025’s market dynamics.
Patrick Welton, Equities/Alternatives:
We are broadly diversified and unconcentrated. Our fund routinely holds more than 250 positions across every liquid asset class. There are generally always some sectors with great opportunity and others with very little. Our fund nearly always benefits from large, sustained changes in equity valuations, rotations, economic fundamentals, interest rates, inflation, and currency flows and finds less opportunity in long periods of market calm with little movement.[/vc_column_text][/vc_column_inner][/vc_row_inner][vc_row_inner][vc_column_inner][mk_divider style=”thin_solid”][vc_column_text css=”.vc_custom_1736352230026{margin-bottom: 0px !important;}”]Important Disclosures:
Diversification Does Not Ensure a Profit or Protect Against a Loss.
An investor should consider the Fund’s investment objectives, risks, charges and expenses carefully before investing or sending money. This and other important information about the Catalyst Funds can be found in the Fund’s prospectus, which can be obtained by calling 1-866-447-4228. Please read the prospectus carefully before investing. The open-end fund products for Catalyst Funds are distributed by Northern Lights Distributors, LLC., Member FINRA/SIPC. Foreside Fund services and Catalyst Capital Advisors are not affiliated with Northern Lights Distributors, LLC. The Catalyst Strategic Income Opportunities Fund is distributed by Foreside Fund Services, LLC, which is not affiliated with Catalyst Capital Advisors LLC, or any of its affiliates.
The Rational Fund Investors should carefully consider the investment objectives, risks, charges and expenses of the Rational Funds. This and other important information about the Funds can be obtained by calling (800) 253-0412 or at www.rationalmf.com. The prospectus should be read carefully before investing. Funds are distributed by Northern Lights Distributors, LLC., Member FINRA/SIPC. Rational Advisors, Inc. is not affiliated with Northern Lights Distributors, LLC.
“Mag 7” or the “Magnificent 7” refers to a group of seven high-performing and influential companies in the U.S. stock market. These companies include Alphabet, Amazon, Apple, Meta Platforms, Microsoft, and NVIDIA.[/vc_column_text][vc_column_text css=”.vc_custom_1734366253431{margin-bottom: 0px !important;}”]20241213-4093686[/vc_column_text][mk_divider style=”thin_solid”][/vc_column_inner][/vc_row_inner][mk_padding_divider size=”20″][vc_raw_html]JTNDc2NyaXB0JTIwdHlwZSUzRCUyMnRleHQlMkZqYXZhc2NyaXB0JTIyJTIwc3JjJTNEJTIyaHR0cHMlM0ElMkYlMkZjb2RlLmpxdWVyeS5jb20lMkZqcXVlcnktMS45LjEubWluLmpzJTIyJTNFJTNDJTJGc2NyaXB0JTNFJTBBJTNDc2NyaXB0JTIwc3JjJTNEJTIyaHR0cHMlM0ElMkYlMkZjZG5qcy5jbG91ZGZsYXJlLmNvbSUyRmFqYXglMkZsaWJzJTJGbW9tZW50LmpzJTJGMi4xOC4xJTJGbW9tZW50Lm1pbi5qcyUyMiUzRSUzQyUyRnNjcmlwdCUzRSUwQSUwQSUzQ3NjcmlwdCUyMHR5cGUlM0QlMjJ0ZXh0JTJGamF2YXNjcmlwdCUyMiUzRSUwQSUyMCUyMCUyNCUyOGRvY3VtZW50JTI5LnJlYWR5JTI4ZnVuY3Rpb24lMjglMjklMjAlN0IlMEElMjAlMjAlMjAlMjQlMjglMjIuZGF0ZWZvcm1hdCUyMiUyOS5odG1sJTI4ZnVuY3Rpb24lMjhpbmRleCUyQyUyMHZhbHVlJTI5JTIwJTdCJTBBJTIwJTIwJTIwJTIwcmV0dXJuJTIwbW9tZW50JTI4dmFsdWUlMkMlMjAlMjJZWVlZLU1NLUREVEhIJTNBbW0lM0FzcyUyMiUyOS5mb3JtYXQlMjglMjJNTS1ERC1ZWVlZJTIyJTI5JTNCJTBBJTdEJTI5JTNCJTBBJTBBJTIwJTIwJTdEJTI5JTNCJTBBJTNDJTJGc2NyaXB0JTNF[/vc_raw_html][/vc_column][/vc_row]
Income Shines: November 2024 HANDLS Monthly Report
Income Sectors Shine
November proved to be a strong month for income-focused investments, with all sectors delivering positive returns despite market volatility. Leading the charge were MLPs, which surged 12.60%, benefiting from a favorable energy environment and rising commodity prices. This sector’s robust income generation continues to attract investors seeking yield in a stable energy backdrop. REITs followed far behind with a 3.54% return. While interest rates remain a challenge, strong demand for both commercial and residential properties kept the sector resilient. Similarly, Dividend Equities posted a strong 5.40%, benefiting from the broader market’s continued strength and providing investors with a balance of income and growth. Utilities delivered 3.78%, as their defensive nature remained appealing to investors seeking stability. With ongoing market uncertainty, the reliable income stream from utilities remains attractive. Growth & Income strategies also performed well, returning 5.84%, reflecting a mix of steady income and equity exposure. High Yield Bonds generated a modest 1.67%, as investor appetite for riskier assets remained cautious in the face of tighter credit spreads. Covered Calls posted 4.31%, as the strategy took advantage of solid equity performance while generating additional income through options.
In fixed income, Preferreds saw a modest 0.80% return, weighed down by ongoing interest rate pressures. However, Build America Bonds and MBS performed decently with returns of 1.66% and 1.51%, respectively, supported by favorable market conditions in infrastructure and mortgages. Investment Grade Corporate Bonds saw a moderate 1.26%, while Active Fixed Income strategies posted 1.34%, as managers adjusted exposures to navigate rate changes. On the equity front, Large Cap Equity returned 5.57%, reflecting strong corporate earnings.
For the Nasdaq HANDL™ Indexes, November was a very solid month highlighting the strength of a diversified basket. For the month of November:
- Nasdaq 5HANDL™ Index: 3.78%
- Nasdaq 7HANDL™ Index: 4.81% (1.3x leveraged)
- Nasdaq 10HANDL™ Index: 7.24% (2.0x leveraged)
Overall, November demonstrated the resilience of income-focused investments across various sectors, offering solid returns in a dynamic market environment. As interest rates continue to adjust, investors are finding attractive opportunities in sectors that blend stability and income, reinforcing the value of diversification within portfolios.
Disclosure: Nasdaq® is a registered trademark of Nasdaq, Inc. The information contained above is provided for informational and educational purposes only, and nothing contained herein should be construed as investment advice, either on behalf of a particular security or an overall investment strategy. Neither Nasdaq, Inc. nor any of its affiliates makes any recommendation to buy or sell any security or any representation about the financial condition of any company. Statements regarding Nasdaq-listed companies or Nasdaq proprietary indexes are not guarantees of future performance. Actual results may differ materially from those expressed or implied. Past performance is not indicative of future results. Investors should undertake their own due diligence and carefully evaluate companies before investing. ADVICE FROM A SECURITIES PROFESSIONAL IS STRONGLY ADVISED. © 2024. Nasdaq, Inc. All Rights Reserved
Important Disclosure. HANDLS Indexes receives compensation in connection with licensing its indices to third parties. Any returns or performance provided within are for illustrative purposes only and do not demonstrate actual performance. Past performance is not a guarantee of future investment results. It is not possible to invest directly in an index. Exposure to an asset class is available through investable instruments based on an index. HANDLS Indexes does not sponsor, endorse, sell, promote or manage any investment fund or other vehicle that is offered by third parties and that seeks to provide an investment return based on the returns of any index. There is no assurance that investment products based on an index will accurately track index performance or provide positive investment returns. HANDLS Indexes is not an investment advisor, and HANDLS Indexes makes no representation regarding the advisability of investing in any such investment fund or other vehicle. A decision to invest in any such investment fund or other vehicle should not be made in reliance on any of the statements set forth in this document. Prospective investors are advised to make an investment in any such fund or other vehicle only after carefully considering the risks associated with investing in such funds, as detailed in an offering memorandum or similar document that is prepared by or on behalf of the issuer of the investment fund or other vehicle. Inclusion of a security within an index is not a recommendation by Indexes to buy, sell, or hold such security, nor is it considered to be investment advice. The information contained herein is intended for personal use only and should not be relied upon as the basis for the execution of a security trade. Investors are advised to consult with their broker or other financial representative to verify pricing information for any securities referenced herein. Neither Indexes nor any of its direct or indirect third-party data suppliers or their affiliates shall have any liability for the accuracy or completeness of the information contained herein, nor for any lost profits, indirect, special or consequential damages. Either Indexes or its direct or indirect third-party data suppliers or their affiliates have exclusive proprietary rights in any information contained herein. The information contained herein may not be used for any unauthorized purpose or redistributed without prior written approval from HANDLS Indexes. Copyright © 2024 by HANDLS Indexes. All rights reserved.
What Investors Can Do When Equities Get Ahead of Themselves
[vc_row][vc_column css=”.vc_custom_1532034303005{background-color: #ffffff !important;}”][vc_row_inner][vc_column_inner][mk_padding_divider size=”150″][mk_fancy_title size=”40″ force_font_size=”true” size_smallscreen=”40″ size_tablet=”30″ size_phone=”30″ font_weight=”bold” txt_transform=”capitalize” margin_bottom=”0″ font_family=”none”]
What Investors Can Do When Equities Get Ahead of Themselves
[/mk_fancy_title][vc_column_text css=”.vc_custom_1732569771142{margin-bottom: 0px !important;}”]Leveraging a balanced risk strategy like MBXIX as a path to less volatility.[/vc_column_text][vc_column_text css=”.vc_custom_1732570149654{margin-bottom: 0px !important;}”]November 2024[/vc_column_text][mk_divider style=”thin_solid” margin_top=”0″][vc_column_text css=”.vc_custom_1732570227310{margin-bottom: 0px !important;}”]Even before the post-election rally, Wall Street was growing increasingly worried that the stock market was starting to get ahead of itself. In October, Goldman Sachs strategists cautioned investors to be prepared for stock market returns during the next decade that are toward the lower end of their typical performance distribution.
As of November 11, 2024, the cyclically adjusted price-to-earnings ratio (or CAPE) hit a staggering 38.12x. Looking at these valuation levels going back to 1900, there has only been one instance where the S&P 500 produced a positive return in the following 10 years. In July 1998, the CAPE hit 38.26x and the 10-year return after was 0.84% annualized. There is good reason to be concerned.[/vc_column_text][/vc_column_inner][/vc_row_inner][vc_row_inner][vc_column_inner css=”.vc_custom_1553117738807{background-color: #ffffff !important;}”][mk_fancy_title color=”#000000″ size=”18″ font_weight=”bold” txt_transform=”capitalize” margin_bottom=”0″ font_family=”none” align=”center”]S&P 500 market capitalization as % of GDP (the “Buffett Indicator”) reached a peak level at +172%1[/mk_fancy_title][vc_single_image image=”4019″ img_size=”full”][vc_column_text css=”.vc_custom_1732570321086{margin-bottom: 0px !important;}”]1Bloomberg LP and U.S. Bureau of Economic Analysis. Based on quarterly data from 6/30/2000 to 9/30/2024.[/vc_column_text][vc_column_text css=”.vc_custom_1695670169602{margin-bottom: 0px !important;}”][/vc_column_text][/vc_column_inner][/vc_row_inner][vc_row_inner][vc_column_inner css=”.vc_custom_1553117738807{background-color: #ffffff !important;}”][mk_fancy_title color=”#000000″ size=”18″ font_weight=”bold” txt_transform=”capitalize” margin_bottom=”0″ font_family=”none” align=”center”]S&P 500 10-year returns averaged -2.75% annualized following valuations like in November 20242[/mk_fancy_title][vc_single_image image=”4020″ img_size=”full”][vc_column_text css=”.vc_custom_1695670169602{margin-bottom: 0px !important;}”][/vc_column_text][/vc_column_inner][/vc_row_inner][vc_row_inner][vc_column_inner css=”.vc_custom_1553117738807{background-color: #ffffff !important;}”][mk_fancy_title color=”#000000″ size=”18″ font_weight=”bold” txt_transform=”capitalize” margin_bottom=”0″ font_family=”none” align=”center”]U.S. stock market trailing 15-year return in relation to returns going back to 18713[/mk_fancy_title][vc_single_image image=”4021″ img_size=”full”][vc_column_text css=”.vc_custom_1732570962725{margin-bottom: 0px !important;}”]2, 3Robert J. Shiller. US Stock Price, Earnings and Dividends as well as Interest Rates and Cyclically Adjusted Price Earnings Ratio (CAPE) since 1871. Data as of November 11, 2024.[/vc_column_text][vc_column_text css=”.vc_custom_1695670169602{margin-bottom: 0px !important;}”][/vc_column_text][/vc_column_inner][/vc_row_inner][vc_row_inner][vc_column_inner css=”.vc_custom_1553117738807{background-color: #ffffff !important;}”][mk_fancy_title color=”#000000″ size=”20″ font_weight=”bold” txt_transform=”uppercase” margin_bottom=”0″ font_family=”none”]Look to a balanced risk strategy for a solution to concerns about stock market valuations[/mk_fancy_title][vc_column_text css=”.vc_custom_1732657570155{margin-bottom: 0px !important;}”]While the indicators are suggesting lower returns for the long term, it is anybody’s guess as to how far the stock market can go before, or if, it turns. In other words, getting out of the market may mean potentially missing out on some upside. A balanced risk strategy (or hybrid strategy) is a potentially compelling solution for investors trying to balance stretched valuations and the desire to avoid missing out on potential market upside. Balanced risk strategies typically combine alternative and traditional investment strategies within one product wrapper, creating a product with the potential to play offense and defense.[/vc_column_text][vc_column_text css=”.vc_custom_1732571163701{margin-bottom: 0px !important;}”]A compelling example of such a strategy is the Catalyst/Millburn Hedge Strategy Fund (MBXIX). Whether looking to complement traditional investments or replacing pure equity, MBXIX combines an allocation to long-only equity ETFs with a long/short futures portfolio that spans 125+ global markets. This strategy has the potential to provide positive returns in both bear and bull markets, and MBXIX has done so historically since inception in 1997.[/vc_column_text][mk_fancy_title color=”#000000″ size=”20″ font_weight=”bold” txt_transform=”capitalize” margin_bottom=”0″ font_family=”none” align=”center”]The offense + defense approach of MBXIX allowed it to outperform the S&P 500 TR Index4[/mk_fancy_title][vc_single_image image=”4022″ img_size=”full”][vc_column_text css=”.vc_custom_1732571406341{margin-bottom: 0px !important;}”]Past performance does not guarantee future results.[/vc_column_text][vc_column_text css=”.vc_custom_1732571239366{margin-bottom: 0px !important;}”]4Bloomberg LP and Catalyst Capital Advisors LLC. Based on monthly return data from 12/31/1996 to 09/30/2024. Presented in logarithmic scale.[/vc_column_text][vc_column_text css=”.vc_custom_1695670169602{margin-bottom: 0px !important;}”][/vc_column_text][/vc_column_inner][/vc_row_inner][vc_row_inner][vc_column_inner css=”.vc_custom_1553117738807{background-color: #ffffff !important;}”][vc_column_text css=”.vc_custom_1732571393477{margin-bottom: 0px !important;}”]For investors concerned about stock market returns in the coming 10 years, a great place to start in evaluating alternatives is to look at rolling 10-year returns. In analyzing the S&P 500 TR Index back to the inception date of MBXIX, one can see that the S&P 500 TR Index had negative 10-year rolling returns 11% of the time, making the prospects of another negative 10-year return seem not so unlikely. On the other hand, MBXIX was consistently positive.
The worst return was +4.94% annualized, a respectable return for long-term investment objectives. There were periods of equity market exuberance where MBXIX did not keep up, but on average, the historically less volatile balanced risk strategy approach resulted in meaningfully higher average returns for the rolling 10-year periods.[/vc_column_text][mk_fancy_title color=”#000000″ size=”18″ font_weight=”bold” margin_bottom=”0″ font_family=”none” align=”center”]MBXIX demonstrated its ability to produce positive and consistent rolling 10-year returns5[/mk_fancy_title][vc_single_image image=”4023″ img_size=”full”][vc_column_text css=”.vc_custom_1732571492317{margin-bottom: 0px !important;}”]5Bloomberg LP and Catalyst Capital Advisors LLC. Based on monthly return data from 12/31/1996 to 09/30/2024. Presented in logarithmic scale.[/vc_column_text][vc_column_text css=”.vc_custom_1695670169602{margin-bottom: 0px !important;}”][/vc_column_text][/vc_column_inner][/vc_row_inner][vc_row_inner][vc_column_inner][mk_divider style=”thin_solid”][vc_column_text css=”.vc_custom_1732572074821{margin-bottom: 0px !important;}”]The Fund’s maximum sales charge for Class “A” shares is 5.75%. Investments in mutual funds involve risks. Performance is historic and does not guarantee future results. Investment return and principal value will fluctuate with changing market conditions so that when redeemed, shares may be worth more or less than their original cost. Current performance may be lower or higher than the performance data quoted. To obtain the most recent month end performance information or the funds prospectus please call the fund, toll free at 1-866-447-4228. You can also obtain a prospectus at www.CatalystMF.com.The Fund’s gross expense ratios are 2.28%, 3.03%, and 2.03% for Class A, C, and I, respectively.
There is no assurance that the Fund will achieve its investment objective. You cannot invest directly in an index and unmanaged index returns do not reflect any fees, expenses or sales charges. Performance shown before December 28, 2015 is for the Fund’s Predecessor Fund (Millburn Hedge Fund, L.P.).[/vc_column_text][vc_column_text css=”.vc_custom_1732572302206{margin-bottom: 0px !important;}”]Past performance is not a guarantee of future results.
Investors should carefully consider the investment objectives, risks, charges and expenses of the Catalyst Funds. This and other important information about the Fund can be obtained by calling 866-447-4228. The Catalyst Funds are distributed by Northern Lights Distributors, LLC, member FINRA/SIPC. Catalyst Capital Advisors, LLC is not affiliated with Northern Lights Distributors, LLC.
Risk Considerations:
Investing in the Fund carries certain risks. The Fund will invest a percentage of its assets in derivatives, such as futures and options contracts. The use
of such derivatives and the resulting high portfolio turnover may expose the Fund to additional risks that it would not be subject to if it invested directly
in the securities and commodities underlying those derivatives. The Fund may experience losses that exceed those experienced by funds that do not use futures contracts, options and hedging strategies. Investing in commodities markets may subject the Fund to greater volatility than investments in traditional securities. Currency trading risks include market risk, credit risk and country risk. Foreign investing involves risks not typically associated with U.S. investments. Changes in interest rates and the liquidity of certain investments could affect the Fund’s overall performance. The Fund is non-diversified and as a result, changes in the value of a single security may have significant effect on the Fund’s value. Other risks include U.S. Government securities risks and investments in fixed income securities. Typically, a rise in interest rates causes a decline in the value of fixed income securities or derivatives owned by the Fund. Furthermore, the use of leveraging can magnify the potential for gain or loss and amplify the effects of market volatility on the Fund’s share price. The Fund is subject to regulatory change and tax risks; changes to current rules could increase costs associated with an investment in the Fund. These factors may affect the value of your investment.
Performance shown before December 28, 2015 is for the Fund’s Predecessor Fund (Millburn Hedge Fund, L.P.). The prior performance is net of management fees and other expenses including the effect of the performance fee. The Predecessor Fund had an investment objective and strategies that were, in all material respects, the same as those of the Fund, and was managed in a manner that, in all material respects, complied with the investment guidelines and restrictions of the Fund. From its inception through December 28, 2015, the Predecessor Fund was not subject to certain investment restrictions, diversification requirements and other restrictions of the 1940 Act or the Code, which if they had been applicable, might have adversely affected its performance. In addition, the Predecessor Fund was not subject to sales loads that would have adversely affected performance. Performance of the predecessor fund is not an indicator of future results.
Investors cannot directly invest in an index and unmanaged index returns do not reflect any fees, expenses or sales charges.
There is no guarantee that any investment strategy will achieve its objectives, generate profits, or avoid losses.[/vc_column_text][vc_column_text css=”.vc_custom_1732571915029{margin-bottom: 0px !important;}”]Data as of quarter end: 2021-03-31T00:00:00
Annualized if greater than a year[/vc_column_text][mk_table]
| Share Class | 1 Month | 3 Months | 6 Months | YTD | 1 Year | 3 Years Annualized | 5 Years Annualized | 10 Years Annualized | Since Inception Annualized |
| Class I | 0.73% | 7.43% | 18.30% | 7.43% | 40.19% | 7.48% | 8.16% | 7.28% | 10.69% |
| Class A | 0.70% | 7.36% | 18.16% | 7.36% | 39.83% | 7.20% | 7.89% | N/A | 8.95% |
| Class C | 0.65% | 7.18% | 17.72% | 7.18% | 38.79% | 6.41% | 7.09% | N/A | 8.13% |
| Class C-1 | 0.65% | 7.18% | N/A | 7.18% | N/A | N/A | N/A | N/A | 22.67% |
| Class A w/Sales Load | -5.10% | 1.19% | 11.36% | 1.19% | 31.81% | 5.11% | 6.62% | N/A | 7.73% |
[/mk_table][mk_divider style=”thin_solid”][vc_column_text css=”.vc_custom_1732572509709{margin-bottom: 0px !important;}”]Definitions:
The CAPE ratio is a valuation measure that uses real earnings per share over a 10-year period to provide a smoother display of fluctuations in corporate
profits.
The S&P 500 is a market capitalization-weighted index that is used to represent the U.S. large-cap stock market.
A long position refers to the purchase of an asset with the expectation it will increase in value, while a short position is a trading technique in which
a trader sells a security first with the intention of repurchasing it or covering it later at a lower price. A long/short portfolio combines both of these
positions.
A bear market is a financial market experiencing prolonged price declines, generally of 20% or more.
A bull market is a financial market in which prices are rising or are expected to rise over an extended period of time.
The S&P 500 Total Return Index is a total return index that reflects both changes in the prices of stocks in the S&P 500 Index as well
as the reinvestment of the dividend income from its underlying stocks.
Volatility is a statistical measure of dispersion of returns for a specific market index or security.
20241125-4040819[/vc_column_text][/vc_column_inner][/vc_row_inner][mk_padding_divider size=”20″][vc_raw_html]JTNDc2NyaXB0JTIwdHlwZSUzRCUyMnRleHQlMkZqYXZhc2NyaXB0JTIyJTIwc3JjJTNEJTIyaHR0cHMlM0ElMkYlMkZjb2RlLmpxdWVyeS5jb20lMkZqcXVlcnktMS45LjEubWluLmpzJTIyJTNFJTNDJTJGc2NyaXB0JTNFJTBBJTNDc2NyaXB0JTIwc3JjJTNEJTIyaHR0cHMlM0ElMkYlMkZjZG5qcy5jbG91ZGZsYXJlLmNvbSUyRmFqYXglMkZsaWJzJTJGbW9tZW50LmpzJTJGMi4xOC4xJTJGbW9tZW50Lm1pbi5qcyUyMiUzRSUzQyUyRnNjcmlwdCUzRSUwQSUwQSUzQ3NjcmlwdCUyMHR5cGUlM0QlMjJ0ZXh0JTJGamF2YXNjcmlwdCUyMiUzRSUwQSUyMCUyMCUyNCUyOGRvY3VtZW50JTI5LnJlYWR5JTI4ZnVuY3Rpb24lMjglMjklMjAlN0IlMEElMjAlMjAlMjAlMjQlMjglMjIuZGF0ZWZvcm1hdCUyMiUyOS5odG1sJTI4ZnVuY3Rpb24lMjhpbmRleCUyQyUyMHZhbHVlJTI5JTIwJTdCJTBBJTIwJTIwJTIwJTIwcmV0dXJuJTIwbW9tZW50JTI4dmFsdWUlMkMlMjAlMjJZWVlZLU1NLUREVEhIJTNBbW0lM0FzcyUyMiUyOS5mb3JtYXQlMjglMjJNTS1ERC1ZWVlZJTIyJTI5JTNCJTBBJTdEJTI5JTNCJTBBJTBBJTIwJTIwJTdEJTI5JTNCJTBBJTNDJTJGc2NyaXB0JTNF[/vc_raw_html][/vc_column][/vc_row]
What’s the Real Value of Active Management?
Key Summary:
- ETF’s have become the preferred investment wrapper of choice for investors.
- The vast majority of ETF assets are passive, rules-based, & market-cap weighted.
- Active strategies with high tracking error can add significant value to the portfolio mix.
Very Important thesis: If equities generate roughly ~10-11% a year over time, leading brands, dominant global franchises, particularly those serving the dominant driver of the economy, in theory, should compound at 13-15%+ over time. In a world where rates and inflation will likely trend higher for longer, business models with pricing power, exposure to quality factors, and that generate strong profits and free cash are set up to win versus broad markets. Brands Matter.
ETFs are the Preferred Investment Wrapper.
The data is very clear: actively managed mutual funds continue to lose assets to ETF’s. That’s the headline we all see every day. Remember, headlines are bold because they want your attention, the real story lives in the details. It makes sense that a portion of the active market is losing share to ETFs. Why pay a higher fee for a less tax efficient strategy, particularly if it’s a closet index strategy? In my opinion, true active strategies have a very important role in portfolios as complements to passive, cheap beta. Advisors need to understand what they own. Are the active funds’ benchmark huggers or do they do things very differently than the benchmark? Is there a similar strategy available in an ETF wrapper? Important: to have the chance to beat a benchmark, a strategy needs to look very different than the benchmark. The way to track this is by using Tracking Error. A high tracking error means the fund looks very different and can therefore be very valuable to a portfolio from a diversification and returns perspective. If you can get access to the themes you want and do it in a tax efficient wrapper while gaining high tracking error, congratulations, that’s valuable! Spoiler alert: that’s not easy to do, it requires a lot of research and sadly, the analytics providers do not make the research easy because they rarely look at the sector, sub-industry, and single-stock level.
In this week’s note, I’ll make the case that active deserves a place in portfolio’s along with passive ETF’s. Thank heavens there are more active ETF’s being launched because the market has been dominated by passive, rules-based, market cap weighted ETF’s (90% of ETF assets). What does that mean for a portfolio? It means more and more portfolio’s look the same and they are more tied to MOMENTUM as a style factor than ever before. That works until it doesn’t. This also means, benchmark hugging active managers are also too tethered to the momentum factor making “size and momentum” the biggest part of most portfolios.
Active, Contrarian Opportunities Are Everywhere.

Image: Created for Eric Clark by ChatGPT.
I am not saying run from passive, market-cap weighted ETF’s, I’m simply saying properly active strategies should be blended with passive, so portfolio’s get the benefit from many different style factors and exposures. As more and more “active funds” take on more passive characteristics, the value of true active strategies will grow by leaps and bounds. One area that’s likely the least crowded trade: the Consumer Discretionary, Consumer Staples, and Communication Services sectors. Our team traffics in highly relevant, high quality global brands. Many of which live in these three sectors and as you can see below, at the index level, these sectors are under-represented in a meaningful way, while a heavy tech weighting drives the returns. If the S&P 500 is the proxy investment for an allocation to the U.S. economy, and the economy is 70% household consumption, why on earth would the weighting to Consumer Discretionary & Staples be this low? We think that’s the opportunity today for investors.
I can almost guarantee your portfolio is chronically underweight the primary beneficiaries of a consumption-led economy. As you can see below, Tech holds the highest weighting across blend and growth indexes and Consumer Discretionary, Staples, and Communication Services is low. In the brands portfolio, we have 2-3x the discretionary and staples exposure, 40% more communication services and one-third the tech exposure. Our tracking error is almost 10, and this is not an accident.
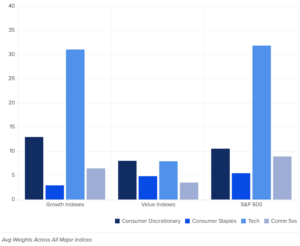
What Does High Tracking Error Look Like?
To highlight the high tracking error theme, below I show a chart of the top 10 brands and the weights in the Brands portfolio relative to the S&P 500 and the Russell 1000 Growth Index. Remember, these two broad style boxes are where the bulk of the typical portfolio is allocated. In the brands strategy, we focus on the dominant global theme of household consumption and business innovation spending through the leading brands. According to the economy and business cycle, we allocate to important sub-themes through market share leaders. Here’s why the tracking error is high. We own a lot of brands that are significantly under-represented or fully absent from indexes. That’s valuable!
The Top 10 Brands in the Brands Portfolio (57% of the total):
- Amazon: 15% versus 3.8% (S&P 500), 6.6% (R1Growth).
- Apollo Global: 6% versus ,0.55% in both indexes.
- Netflix: 5% versus <1.2%.
- Live Nation: 4.9% versus essentially 0%.
- Blackstone: 5% versus <.50%.
- Chipotle: 4.9% versus <.30%.
- KKR: 4.9% versus <0.20%.
- Costco: 4.7% versus <1.5%.
- L’Oreal: 4.7% versus 0%.
- Meta: 4.6% versus <4%.
Bottom Line:
- If you own any active funds or ETF’s, make sure they are truly active and have high tracking error to the benchmark.
- Blend active and passive in a portfolio to achieve maximum diversification and return benefits.
- Do not ignore the winners in a consumption led global economy, these brands are wonderful businesses, have significant economic moats, generate massive profits, and always have demand for their shares when the stocks go on sale. That makes them terrific adds to a portfolio and right now, buying consumer-focused brands is likely the least crowded trade in markets.
BE A CONTRARIAN
Disclosure: The above data is for illustrative purposes only. This information was produced by Accuvest and the opinions expressed are those of the author as of the date of writing and are subject to change. Any research is based on the author’s proprietary research and analysis of global markets and investing. The information and/or analysis presented have been compiled or arrived at from sources believed to be reliable, however the author does not make any representation as their accuracy or completeness and does not accept liability for any loss arising from the use hereof. Some internally generated information may be considered theoretical in nature and is subject to inherent limitations associated therein. There are no material changes to the conditions, objectives or investment strategies of the model portfolios for the period portrayed. Any sectors or allocations referenced may or may not be represented in portfolios managed by the author, and do not represent all of the securities purchased, sold or recommended for client accounts. The reader should not assume that any investments in sectors and markets identified or described were or will be profitable. Investing entails risks, including possible loss of principal. The use of tools cannot guarantee performance. The charts depicted within this presentation are for illustrative purposes only and are not indicative of future performance. Past performance is no guarantee of future results.
How to Position Your Portfolio for A Lost Decade for Stocks and Bonds
[vc_row][vc_column css=”.vc_custom_1532034303005{background-color: #ffffff !important;}”][vc_row_inner][vc_column_inner][mk_padding_divider size=”150″][mk_fancy_title size=”40″ force_font_size=”true” size_smallscreen=”40″ size_tablet=”30″ size_phone=”30″ font_weight=”bold” txt_transform=”capitalize” margin_bottom=”0″ font_family=”none”]
How to Position Your Portfolio for A Lost Decade for Stocks and Bonds
[/mk_fancy_title][vc_column_text css=”.vc_custom_1734009183306{margin-bottom: 0px !important;}”]A fund like MBXIX has the potential to add value to a portfolio during a lost decade.[/vc_column_text][vc_column_text css=”.vc_custom_1734009316859{margin-bottom: 0px !important;}”]October 2024[/vc_column_text][mk_divider style=”thin_solid” margin_top=”0″][vc_column_text css=”.vc_custom_1734009333979{margin-bottom: 0px !important;}”]A lost decade | a decade where an asset class generates negative returns – can derail an investor’s
long-term financial goals. Near-zero yields that are bound to increase combined with stretched equity valuations and growing risks have had investors with heavy exposure to “traditional” portfolio models on alert for years. While investors may have seen the S&P’s bounceback in 2023 as a sign that we’re out of the woods, it’s important to note that this recovery also happened in the 2000’s (as illustrated below) during the prior lost decade and we believe that investors should remain vigilant given the fragile market environment in which we remain.
Additionally, an October 2024 article from Investment News notes that Goldman Sachs strategists are “warning of lackluster returns over the next decade.” The strategists noted that “investors should be prepared for equity returns during the next decade that are toward the lower end of their typical
performance distribution.” In short, we believe investors shouldn’t view any recent rallies as a sign that a lost decade should be dismissed.
Trying to manage upside participation and downside market risk makes a fund like the Catalyst/Millburn Hedge Strategy Fund (MBXIX) a potentially compelling option for a portfolio. Whether looking to complement traditional investments or replacing pure equity, MBXIX combines an allocation to long-only equity ETFs with a long/short futures portfolio that spans 125+ global markets. This strategy has the potential to provide positive returns in both bear and bull markets, and MBXIX has done so historically since inception in 1997.[/vc_column_text][/vc_column_inner][/vc_row_inner][vc_row_inner][vc_column_inner css=”.vc_custom_1553117738807{background-color: #ffffff !important;}”][mk_fancy_title color=”#000000″ size=”18″ font_weight=”bold” txt_transform=”capitalize” margin_bottom=”0″ font_family=”none” align=”center”]MBXIX Generated a +164% Return During the Last Lost Decade for the S&P 500 Index.[/mk_fancy_title][vc_column_text css=”.vc_custom_1734012817177{margin-bottom: 0px !important;}”][/vc_column_text][vc_column_text css=”.vc_custom_1734009379474{margin-bottom: 0px !important;}”]Source: Catalyst Capital Advisors LLC and Bloomberg LP.
Past performance does not guarantee future results and there is no assurance that the Fund will achieve its investment objective.
[/vc_column_text][vc_column_text css=”.vc_custom_1734009398683{margin-bottom: 0px !important;}”]Despite the drawdown in equities that has already occurred, the S&P 500 TR’s cyclically adjusted price-to-earnings ratio as of September 2024 is still at 38.7x (compared to the long-term average of 20.9x). This suggests that equities could still see an ongoing decline. Likewise, bond yields still remain near historical lows.[/vc_column_text][vc_column_text css=”.vc_custom_1695670169602{margin-bottom: 0px !important;}”][/vc_column_text][/vc_column_inner][/vc_row_inner][vc_row_inner][vc_column_inner css=”.vc_custom_1553117738807{background-color: #ffffff !important;}”][mk_fancy_title color=”#000000″ size=”18″ font_weight=”bold” txt_transform=”capitalize” margin_bottom=”0″ font_family=”none” align=”center”]The S&P 500 Index has not Historically Delivered Strong Returns Following Valuations like September 2024.[/mk_fancy_title][vc_single_image image=”4064″ img_size=”full”][vc_column_text css=”.vc_custom_1734009470756{margin-bottom: 0px !important;}”]Source: Robert Shiller and Catalyst Capital Advisors LLC based on data from 1900 to September 2024.[/vc_column_text][vc_column_text css=”.vc_custom_1695670169602{margin-bottom: 0px !important;}”][/vc_column_text][/vc_column_inner][/vc_row_inner][vc_row_inner][vc_column_inner css=”.vc_custom_1553117738807{background-color: #ffffff !important;}”][mk_fancy_title color=”#000000″ size=”18″ font_weight=”bold” txt_transform=”capitalize” margin_bottom=”0″ font_family=”none” align=”center”]How Does MBXIX Currently Implement its Strategy[/mk_fancy_title][vc_column_text css=”.vc_custom_1695670169602{margin-bottom: 0px !important;}”][/vc_column_text][/vc_column_inner][/vc_row_inner][vc_row_inner attached=”true” column_padding=”5″][vc_column_inner width=”1/2″ css=”.vc_custom_1734011233785{border-bottom-width: 10px !important;background-color: #e8e8e8 !important;border-bottom-color: #8059bd !important;border-bottom-style: solid !important;}”][vc_column_text css=”.vc_custom_1695670169602{margin-bottom: 0px !important;}”][/vc_column_text][mk_fancy_title color=”#000000″ size=”20″ font_weight=”bold” font_family=”none” align=”center”]Passive Equity Portfolio
Approximately $0.50 of notional exposure for every $1.00 invested[/mk_fancy_title][vc_column_text css=”.vc_custom_1734009959451{margin-bottom: 0px !important;}”]
- Designed to provide beta exposure to equities for normal, upward trending markets
- Domestic, developed, and emerging market exposure via ETFs
- U.S. equity exposure diversified by market capitalization (small, mid, and large)
[/vc_column_text][/vc_column_inner][vc_column_inner width=”1/2″ css=”.vc_custom_1734011240266{border-bottom-width: 10px !important;background-color: #e8e8e8 !important;border-bottom-color: #8059bd !important;border-bottom-style: solid !important;}”][mk_fancy_title size=”20″ font_weight=”bold” font_family=”none” align=”center”]Futures Program
Approximately $0.70 of notional exposure for every $1.00 invested[/mk_fancy_title][vc_column_text css=”.vc_custom_1734009980754{margin-bottom: 0px !important;}”]
- Designed to leverage uncorrelated nature for both incremental returns and to offset equities during periods of long-term structural market change
- Multiple model approach
- Implements machine learning technology
[/vc_column_text][/vc_column_inner][/vc_row_inner][vc_row_inner][vc_column_inner css=”.vc_custom_1553117738807{background-color: #ffffff !important;}”][vc_column_text css=”.vc_custom_1734009571515{margin-bottom: 0px !important;}”]The approach cannot be replicated through two different funds as $1.00 allocated separately to futures and equities will only give an investor $1.00 in exposure. With the investment approach of MBXIX, more than 100% notional exposure is possible because collateral required for futures is less than the notional exposure provided (i.e., $0.30 in collateral may be needed for $0.70 in exposure).[/vc_column_text][vc_column_text css=”.vc_custom_1695670169602{margin-bottom: 0px !important;}”][/vc_column_text][/vc_column_inner][/vc_row_inner][vc_row_inner][vc_column_inner css=”.vc_custom_1553117738807{background-color: #ffffff !important;}”][vc_single_image image=”4059″ img_size=”full”][vc_column_text css=”.vc_custom_1734010341626{margin-bottom: 0px !important;}”]Managed Futures involve risks different from, or possibly greater than, the risks associated with investing directly in securities and other traditional investments. there is no guarantee that any investment strategy will achieve its objectives, generate profits or avoid losses. Past performance does not guarantee future results and there is no assurance that the Fund will achieve its investment objective.[/vc_column_text][vc_column_text css=”.vc_custom_1734010362970{margin-bottom: 0px !important;}”]The result for MBXIX over multiple market cycles has been a fund that has outperformed major equity markets during five-year rolling periods without a single negative period from inception to September 30, 2024.
[/vc_column_text][vc_single_image image=”4061″ img_size=”full”][vc_column_text css=”.vc_custom_1734010501466{margin-bottom: 0px !important;}”]Going forward, it’s difficult to predict where markets will end up in 2024. In managing money for clients, we understand the goal is to help investors meet their long-term financial objectives, and this implies not only trying to avoid outsized drawdowns but also generating positive returns. It is for this reason we believe it is an ideal time to replace a meaningful portion of any equity allocation you may have with a strategy like MBXIX, which maintains the upside equity exposure but also provides a diversified and non-correlated futures component that could lead to positive returns in various market environments, including the environment we are in for in 2024 and beyond.
[/vc_column_text][/vc_column_inner][/vc_row_inner][vc_row_inner][vc_column_inner][mk_divider style=”thin_solid”][vc_column_text css=”.vc_custom_1732572074821{margin-bottom: 0px !important;}”]The Fund’s maximum sales charge for Class “A” shares is 5.75%. Investments in mutual funds involve risks. Performance is historic and does not guarantee future results. Investment return and principal value will fluctuate with changing market conditions so that when redeemed, shares may be worth more or less than their original cost. Current performance may be lower or higher than the performance data quoted. To obtain the most recent month end performance information or the funds prospectus please call the fund, toll free at 1-866-447-4228. You can also obtain a prospectus at www.CatalystMF.com.The Fund’s gross expense ratios are 2.28%, 3.03%, and 2.03% for Class A, C, and I, respectively.
There is no assurance that the Fund will achieve its investment objective. You cannot invest directly in an index and unmanaged index returns do not reflect any fees, expenses or sales charges. Performance shown before December 28, 2015 is for the Fund’s Predecessor Fund (Millburn Hedge Fund, L.P.).[/vc_column_text][vc_column_text css=”.vc_custom_1732572302206{margin-bottom: 0px !important;}”]Past performance is not a guarantee of future results.
Investors should carefully consider the investment objectives, risks, charges and expenses of the Catalyst Funds. This and other important information about the Fund can be obtained by calling 866-447-4228. The Catalyst Funds are distributed by Northern Lights Distributors, LLC, member FINRA/SIPC. Catalyst Capital Advisors, LLC is not affiliated with Northern Lights Distributors, LLC.
Risk Considerations:
Investing in the Fund carries certain risks. The Fund will invest a percentage of its assets in derivatives, such as futures and options contracts. The use
of such derivatives and the resulting high portfolio turnover may expose the Fund to additional risks that it would not be subject to if it invested directly
in the securities and commodities underlying those derivatives. The Fund may experience losses that exceed those experienced by funds that do not use futures contracts, options and hedging strategies. Investing in commodities markets may subject the Fund to greater volatility than investments in traditional securities. Currency trading risks include market risk, credit risk and country risk. Foreign investing involves risks not typically associated with U.S. investments. Changes in interest rates and the liquidity of certain investments could affect the Fund’s overall performance. The Fund is non-diversified and as a result, changes in the value of a single security may have significant effect on the Fund’s value. Other risks include U.S. Government securities risks and investments in fixed income securities. Typically, a rise in interest rates causes a decline in the value of fixed income securities or derivatives owned by the Fund. Furthermore, the use of leveraging can magnify the potential for gain or loss and amplify the effects of market volatility on the Fund’s share price. The Fund is subject to regulatory change and tax risks; changes to current rules could increase costs associated with an investment in the Fund. These factors may affect the value of your investment.
Performance shown before December 28, 2015 is for the Fund’s Predecessor Fund (Millburn Hedge Fund, L.P.). The prior performance is net of management fees and other expenses including the effect of the performance fee. The Predecessor Fund had an investment objective and strategies that were, in all material respects, the same as those of the Fund, and was managed in a manner that, in all material respects, complied with the investment guidelines and restrictions of the Fund. From its inception through December 28, 2015, the Predecessor Fund was not subject to certain investment restrictions, diversification requirements and other restrictions of the 1940 Act or the Code, which if they had been applicable, might have adversely affected its performance. In addition, the Predecessor Fund was not subject to sales loads that would have adversely affected performance. Performance of the predecessor fund is not an indicator of future results.
Investors cannot directly invest in an index and unmanaged index returns do not reflect any fees, expenses or sales charges.
There is no guarantee that any investment strategy will achieve its objectives, generate profits, or avoid losses.[/vc_column_text][vc_column_text css=”.vc_custom_1732571915029{margin-bottom: 0px !important;}”]Data as of quarter end: 2021-03-31T00:00:00
Annualized if greater than a year[/vc_column_text][mk_table]
| Share Class | 1 Month | 3 Months | 6 Months | YTD | 1 Year | 3 Years Annualized | 5 Years Annualized | 10 Years Annualized | Since Inception Annualized |
| Class I | 0.73% | 7.43% | 18.30% | 7.43% | 40.19% | 7.48% | 8.16% | 7.28% | 10.69% |
| Class A | 0.70% | 7.36% | 18.16% | 7.36% | 39.83% | 7.20% | 7.89% | N/A | 8.95% |
| Class C | 0.65% | 7.18% | 17.72% | 7.18% | 38.79% | 6.41% | 7.09% | N/A | 8.13% |
| Class C-1 | 0.65% | 7.18% | N/A | 7.18% | N/A | N/A | N/A | N/A | 22.67% |
| Class A w/Sales Load | -5.10% | 1.19% | 11.36% | 1.19% | 31.81% | 5.11% | 6.62% | N/A | 7.73% |
[/mk_table][mk_divider style=”thin_solid”][vc_column_text css=”.vc_custom_1734011355634{margin-bottom: 0px !important;}”]Definitions
Lost Decade: A decade where an asset class generates negative returns. With regards to this piece, the “Lost Decade” referenced is for stocks starting on 12/31/1999 and lasting until 12/31/2009.
Price-to-Earnings Ratio: one of the most widely used metrics for investors and analysts to determine stock valuation. It shows whether a company’s stock price is overvalued or undervalued and can reveal how a stock’s valuation compares with its industry group or a benchmark like the S&P 500 Index.
Cyclically Adjusted Price to Earnings (CAPE) Ratio: A valuation measure that uses real earnings per share (EPS) over a 10-year period to smooth out fluctuations in corporate profits that occur over different periods of a business cycle.
Notional Exposure: A term used by derivatives traders to refer to the total value of the underlying asset in a contract.
Standard deviation: a statistical measurement of the dispersion of a dataset relative to its mean.
S&P 500 Index: A market capitalization-weighted index that is used to represent the U.S. large-cap stock market.
The MSCI All Country World Index (ACWI): a stock index designed to provide a broad measure of global equity market performance.
Russell 2000 Index: a subset of the Russell 3000® Index which is designed to represent approximately 98% of he investable US equity market.
20241025-3969551[/vc_column_text][/vc_column_inner][/vc_row_inner][mk_padding_divider size=”20″][vc_raw_html]JTNDc2NyaXB0JTIwdHlwZSUzRCUyMnRleHQlMkZqYXZhc2NyaXB0JTIyJTIwc3JjJTNEJTIyaHR0cHMlM0ElMkYlMkZjb2RlLmpxdWVyeS5jb20lMkZqcXVlcnktMS45LjEubWluLmpzJTIyJTNFJTNDJTJGc2NyaXB0JTNFJTBBJTNDc2NyaXB0JTIwc3JjJTNEJTIyaHR0cHMlM0ElMkYlMkZjZG5qcy5jbG91ZGZsYXJlLmNvbSUyRmFqYXglMkZsaWJzJTJGbW9tZW50LmpzJTJGMi4xOC4xJTJGbW9tZW50Lm1pbi5qcyUyMiUzRSUzQyUyRnNjcmlwdCUzRSUwQSUwQSUzQ3NjcmlwdCUyMHR5cGUlM0QlMjJ0ZXh0JTJGamF2YXNjcmlwdCUyMiUzRSUwQSUyMCUyMCUyNCUyOGRvY3VtZW50JTI5LnJlYWR5JTI4ZnVuY3Rpb24lMjglMjklMjAlN0IlMEElMjAlMjAlMjAlMjQlMjglMjIuZGF0ZWZvcm1hdCUyMiUyOS5odG1sJTI4ZnVuY3Rpb24lMjhpbmRleCUyQyUyMHZhbHVlJTI5JTIwJTdCJTBBJTIwJTIwJTIwJTIwcmV0dXJuJTIwbW9tZW50JTI4dmFsdWUlMkMlMjAlMjJZWVlZLU1NLUREVEhIJTNBbW0lM0FzcyUyMiUyOS5mb3JtYXQlMjglMjJNTS1ERC1ZWVlZJTIyJTI5JTNCJTBBJTdEJTI5JTNCJTBBJTBBJTIwJTIwJTdEJTI5JTNCJTBBJTNDJTJGc2NyaXB0JTNF[/vc_raw_html][/vc_column][/vc_row]
The Case for Continued Investment in Senior Secured Loans
[vc_row][vc_column css=”.vc_custom_1532034303005{background-color: #ffffff !important;}”][vc_row_inner][vc_column_inner][mk_padding_divider size=”150″][mk_fancy_title size=”40″ force_font_size=”true” size_smallscreen=”40″ size_tablet=”30″ size_phone=”30″ font_weight=”bold” txt_transform=”capitalize” margin_bottom=”0″ font_family=”none”]
The Case for Continued Investment in Senior Secured Loans
[/mk_fancy_title][mk_divider style=”thin_solid” margin_top=”0″][vc_column_text css=”.vc_custom_1726690983290{margin-bottom: 0px !important;}”]Traditionally, many investors have viewed senior secured loans as a tactical, rate-based trade. However, more are now recognizing the resilient attributes of the asset class.
Loans are now becoming a strategic core holding in a variety of investor portfolios. This shift is being driven by a deeper understanding of how the asset class performs across different interest rate and economic environments. An important piece of analysis that many retail investors have underappreciated is the 30+ years of data which demonstrates that senior secured loans have historically enhanced fixed-income portfolios and reduced overall portfolio volatility (Chart 1). While fixed-rate bonds may slightly outperform during periods of intensely falling rates, the long-term benefits of loans should not be overlooked.
In the following charts, we outline the combined returns of the Bloomberg U.S. Aggregate Bond Index (represented by the percentage of the left) and the Credit Suisse Leveraged Loan Index (represented by the percentage on the right) to showcase how adding a percentage of this asset class has historically helped investors.[/vc_column_text][/vc_column_inner][/vc_row_inner][vc_row_inner][vc_column_inner css=”.vc_custom_1553117738807{background-color: #ffffff !important;}”][mk_fancy_title color=”#000000″ size=”20″ font_weight=”bold” margin_bottom=”0″ font_family=”none”]Chart 1: Allocating to Loans Has Historically Increased Returns and Reduced Risk (Shown as % of Bonds/% of Loans)[/mk_fancy_title][vc_single_image image=”3892″ img_size=”full”][vc_column_text css=”.vc_custom_1726691038329{margin-bottom: 0px !important;}”]Source: Catalyst Capital Advisors LLC., Bloomberg LP, and Credit Suisse. Based on monthly return data from 12/31/1993 to 6/30/2024. “90%/10% Portfolio” composed of a 90% allocation to the Bloomberg U.S. Aggregate Bond Index and a 10% allocation to the Credit Suisse Leveraged Loan Index. Remaining portfolio descriptions refer to %Agg / %Leveraged Loan described in the “90%/10%” portfolio. Past performance does not guarantee future results.[/vc_column_text][vc_column_text css=”.vc_custom_1695670169602{margin-bottom: 0px !important;}”][/vc_column_text][/vc_column_inner][/vc_row_inner][vc_row_inner][vc_column_inner css=”.vc_custom_1553117738807{background-color: #ffffff !important;}”][mk_fancy_title color=”#000000″ size=”20″ font_weight=”bold” margin_bottom=”0″ font_family=”none”]Chart 2: Bonds Only Slightly Outperformed Loans During the Longest Falling Rate Period Since 1994[/mk_fancy_title][vc_single_image image=”3893″ img_size=”full”][vc_column_text css=”.vc_custom_1726691205538{margin-bottom: 0px !important;}”]Source: Bloomberg LP & Credit Suisse. Total return based on monthly return data from 2/28/2001 to 05/31/2004. Falling Rate period indicated by a decrease of more than 50 bps and reflects Federal Funds Target Rate rolling 12-month periods from 12/31/1993 to 6/30/2024. Past performance is not a guarantee of future results.[/vc_column_text][vc_column_text css=”.vc_custom_1695670169602{margin-bottom: 0px !important;}”][/vc_column_text][/vc_column_inner][/vc_row_inner][vc_row_inner][vc_column_inner css=”.vc_custom_1553117738807{background-color: #ffffff !important;}”][mk_fancy_title color=”#000000″ size=”20″ font_weight=”bold” margin_bottom=”0″ font_family=”none”]Chart 3: Loans Outperformed Bonds During the Longest Flat Rate Environment Since 1994[/mk_fancy_title][vc_single_image image=”3890″ img_size=”full”][vc_column_text css=”.vc_custom_1726752276354{margin-bottom: 0px !important;}”]Source: Bloomberg LP & Credit Suisse. Total return based on monthly return data from 12/31/2009 to 11/30/2015. Flat rate period indicated by a decrease of less than 50 bps or an increase of less than 50 bps and reflects Federal Funds Target Rate rolling 12-month periods from 12/31/1993 to 6/30/2024. Past performance is not a guarantee of future results.[/vc_column_text][vc_column_text css=”.vc_custom_1695670169602{margin-bottom: 0px !important;}”][/vc_column_text][/vc_column_inner][/vc_row_inner][vc_row_inner][vc_column_inner css=”.vc_custom_1553117738807{background-color: #ffffff !important;}”][mk_fancy_title color=”#000000″ size=”20″ font_weight=”bold” margin_bottom=”0″ font_family=”none”]Chart 4: Loans Outperformed Bonds During the Longest Rising Rate Environment Since 1994[/mk_fancy_title][vc_single_image image=”3891″ img_size=”full”][vc_column_text css=”.vc_custom_1726691455285{margin-bottom: 0px !important;}”]Source: Bloomberg LP & Credit Suisse. Total return based on monthly return data from 12/31/2015 to 08/31/2019. Rising Rate period indicated by an increase of more than 50 bps and reflects Federal Funds Target Rate rolling 12-month periods from 12/31/1993 to 6/30/2024. Past performance is not a guarantee of future results.[/vc_column_text][vc_column_text css=”.vc_custom_1695670169602{margin-bottom: 0px !important;}”][/vc_column_text][/vc_column_inner][/vc_row_inner][vc_row_inner][vc_column_inner css=”.vc_custom_1553117738807{background-color: #ffffff !important;}”][vc_column_text css=”.vc_custom_1726691477119{margin-bottom: 0px !important;}”]While we understand the impulse to move assets to fixed-rate bonds as rates fall, we remind investors that senior secured loans have demonstrated resiliency in rising, falling and flat interest rate environments. We therefore encourage investors to look at the past 30+ years of data and take a long-term approach to constructing their portfolios.[/vc_column_text][mk_fancy_title color=”#000000″ size=”20″ font_weight=”bold” margin_bottom=”0″ font_family=”none”]Summary[/mk_fancy_title][vc_column_text css=”.vc_custom_1695670169602{margin-bottom: 0px !important;}”][/vc_column_text][mk_custom_list]
- Fixed-income portfolios that utilize senior secured loans alongside traditional bonds have seen greater annualized returns with lower volatility since 1994. This has been consistent through numerous rate environments and bear markets investors have faced in the past 30+
- During the longest continuous falling rate environment since 1994, a bond only fixed-income portfolio only slightly outperformed a fixed income portfolio with a 40% allocation to In our view, the performance difference of ~170 bps was offset by the reduced volatility profile of the portfolio that employed loans.
- During the longest continuous flat and rising rate environments, the portfolio that employed a 40% loan allocation outperformed the bond only portfolio by over 300 bps and 200 bps,
- While fixed-rate bonds slightly outperform loans when rates are falling, this effect does not outweigh the outperformance of senior secured loans demonstrated in flat and rising rate
- We believe investors should maintain loan allocations as they evaluate the long-term risk / reward performance prospects of their portfolios.
[/mk_custom_list][/vc_column_inner][/vc_row_inner][vc_row_inner][vc_column_inner][mk_divider style=”thin_solid”][vc_column_text css=”.vc_custom_1726691784676{margin-bottom: 0px !important;}”]Definitions:
Bloomberg US Aggregate Bond Index: A market capitalization-weighted index that is designed to measure the performance of the U.S. investment grade bond market with maturities of more than one year.
Credit Suisse Leveraged Loan Index: An index that tracks the investable market of the U.S. dollar denominated leveraged loan market.
Volatility: A statistical measure of the dispersion of returns for a given security or market index.[/vc_column_text][/vc_column_inner][/vc_row_inner][mk_padding_divider size=”20″][vc_raw_html]JTNDc2NyaXB0JTIwdHlwZSUzRCUyMnRleHQlMkZqYXZhc2NyaXB0JTIyJTNFJTBBX2xpbmtlZGluX3BhcnRuZXJfaWQlMjAlM0QlMjAlMjIxMjczNjY2JTIyJTNCJTBBd2luZG93Ll9saW5rZWRpbl9kYXRhX3BhcnRuZXJfaWRzJTIwJTNEJTIwd2luZG93Ll9saW5rZWRpbl9kYXRhX3BhcnRuZXJfaWRzJTIwJTdDJTdDJTIwJTVCJTVEJTNCJTBBd2luZG93Ll9saW5rZWRpbl9kYXRhX3BhcnRuZXJfaWRzLnB1c2glMjhfbGlua2VkaW5fcGFydG5lcl9pZCUyOSUzQiUwQSUzQyUyRnNjcmlwdCUzRSUzQ3NjcmlwdCUyMHR5cGUlM0QlMjJ0ZXh0JTJGamF2YXNjcmlwdCUyMiUzRSUwQSUyOGZ1bmN0aW9uJTI4bCUyOSUyMCU3QiUwQWlmJTIwJTI4JTIxbCUyOSU3QndpbmRvdy5saW50cmslMjAlM0QlMjBmdW5jdGlvbiUyOGElMkNiJTI5JTdCd2luZG93LmxpbnRyay5xLnB1c2glMjglNUJhJTJDYiU1RCUyOSU3RCUzQiUwQXdpbmRvdy5saW50cmsucSUzRCU1QiU1RCU3RCUwQXZhciUyMHMlMjAlM0QlMjBkb2N1bWVudC5nZXRFbGVtZW50c0J5VGFnTmFtZSUyOCUyMnNjcmlwdCUyMiUyOSU1QjAlNUQlM0IlMEF2YXIlMjBiJTIwJTNEJTIwZG9jdW1lbnQuY3JlYXRlRWxlbWVudCUyOCUyMnNjcmlwdCUyMiUyOSUzQiUwQWIudHlwZSUyMCUzRCUyMCUyMnRleHQlMkZqYXZhc2NyaXB0JTIyJTNCYi5hc3luYyUyMCUzRCUyMHRydWUlM0IlMEFiLnNyYyUyMCUzRCUyMCUyMmh0dHBzJTNBJTJGJTJGc25hcC5saWNkbi5jb20lMkZsaS5sbXMtYW5hbHl0aWNzJTJGaW5zaWdodC5taW4uanMlMjIlM0IlMEFzLnBhcmVudE5vZGUuaW5zZXJ0QmVmb3JlJTI4YiUyQyUyMHMlMjklM0IlN0QlMjklMjh3aW5kb3cubGludHJrJTI5JTNCJTBBJTNDJTJGc2NyaXB0JTNFJTBBJTNDbm9zY3JpcHQlM0UlMEElM0NpbWclMjBoZWlnaHQlM0QlMjIxJTIyJTIwd2lkdGglM0QlMjIxJTIyJTIwc3R5bGUlM0QlMjJkaXNwbGF5JTNBbm9uZSUzQiUyMiUyMGFsdCUzRCUyMiUyMiUyMHNyYyUzRCUyMmh0dHBzJTNBJTJGJTJGcHguYWRzLmxpbmtlZGluLmNvbSUyRmNvbGxlY3QlMkYlM0ZwaWQlM0QxMjczNjY2JTI2Zm10JTNEZ2lmJTIyJTIwJTJGJTNFJTBBJTNDJTJGbm9zY3JpcHQlM0U=[/vc_raw_html][/vc_column][/vc_row]